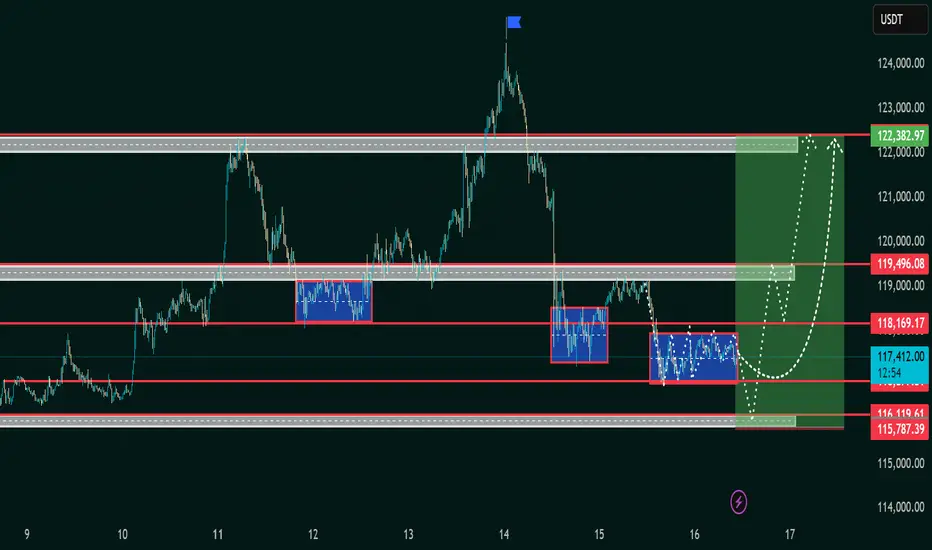
The chart highlights a corrective phase after a strong decline, where price is currently consolidating in the 117,000–116,000 USDT support zone. This range has acted as a demand area, showing repeated accumulation (blue boxes).
Key observations:
Support Zones: Strong demand seen between 115,800 – 116,200 USDT, which has held multiple times.
Resistance Levels:
Immediate resistance at 118,169 USDT
Secondary resistance at 119,496 USDT
Major resistance/target at 122,382 USDT
Pattern Formation: Price action suggests a potential inverse accumulation range that could trigger a bullish reversal.
Projected Move: If price sustains above 118,169 USDT, it may test 119,500 USDT before targeting the 122,000–122,400 USDT supply zone.
Risk Zone: A break below 115,800 USDT could invalidate the bullish outlook and push price lower.
📌 Summary: BTC/USDT is consolidating at a key support area. A breakout above 118,169 USDT may trigger a bullish continuation towards 122,000 USDT, while failure to hold 115,800 USDT risks further downside
交易开始
Market Analyst | Forex Mentor | XAUUSD Specialist
Services Offered:
• VIP Signals
• 1-on-1 Mentorship
• Professional Forex Course
• Affiliate Program
• Strategic Partnerships
Link to Join
t.me/Booming_bulls_10
Services Offered:
• VIP Signals
• 1-on-1 Mentorship
• Professional Forex Course
• Affiliate Program
• Strategic Partnerships
Link to Join
t.me/Booming_bulls_10
免责声明
这些信息和出版物并不意味着也不构成TradingView提供或认可的金融、投资、交易或其它类型的建议或背书。请在使用条款阅读更多信息。