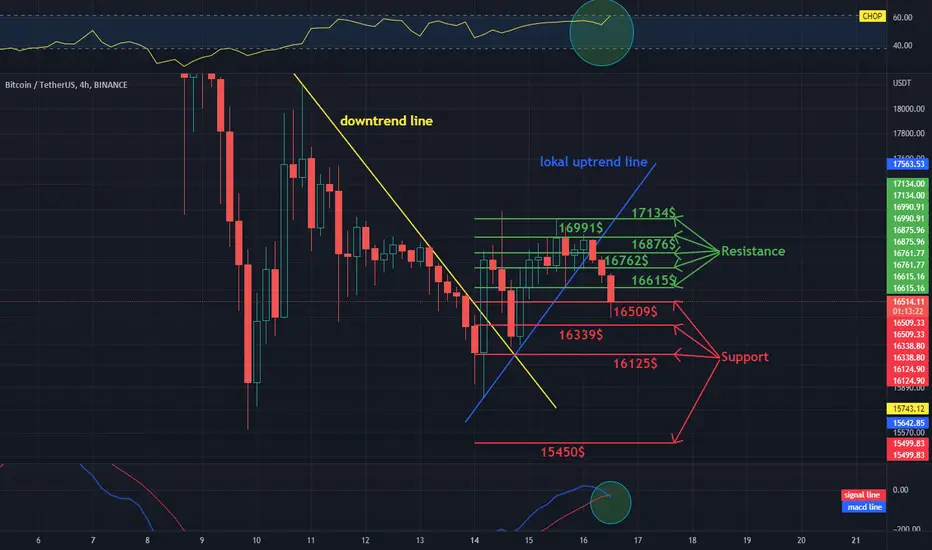
Hello everyone, let's look at the BTC to USDT chart on a 4-hour timeframe. As you can see, the price has moved above the downtrend line marked in yellow, however, we have now fallen below the local uptrend line.
Let's start with the support line and as you can see the first support at which the price is $16509, if the support is broken then the next support is $16339, $16125 and $15450.
Now let's go from the resistance line, as you can see the first resistance is $16615, if you manage to break it, the next resistance will be $16762, $16876, $16991 and $17134.
Looking at the CHOP indicator, we see that we have a lot of energy in the 4-hour interval, while the MACD indicator indicates that the blue line has crossed the red one from above, which confirms the local downtrend.
免责声明
这些信息和出版物并不意味着也不构成TradingView提供或认可的金融、投资、交易或其它类型的建议或背书。请在使用条款阅读更多信息。
免责声明
这些信息和出版物并不意味着也不构成TradingView提供或认可的金融、投资、交易或其它类型的建议或背书。请在使用条款阅读更多信息。