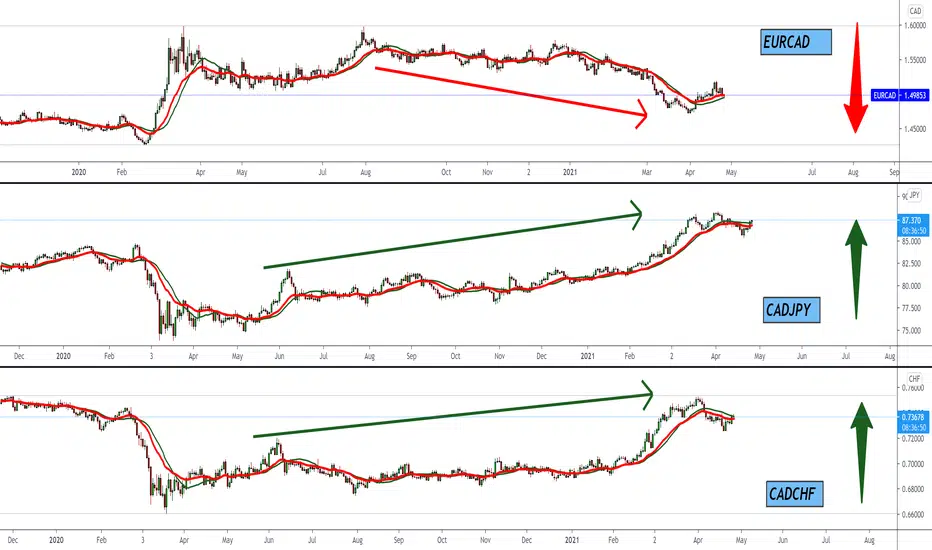
We have three charts to compare:
In the first chart, here we see that the EURCAD is in a bearish trend,
In the second chart, here is a bullish trend, and here we see that CADJPY monitors the movement and mostly coincides with the chart CADCHF, and is totally the opposite of the EURCAD chart,
In the third chart, here we see that CADCHF is totally the opposite of the EURCAD chart, also a bullish trend.
When the EURCAD falls, CADJPY and the CADCHF rises.
This way, you can combine these pairs.
What do you think about that?
Free telegram channel t.me/alexmasterforex
免责声明
这些信息和出版物并非旨在提供,也不构成TradingView提供或认可的任何形式的财务、投资、交易或其他类型的建议或推荐。请阅读使用条款了解更多信息。
Free telegram channel t.me/alexmasterforex
免责声明
这些信息和出版物并非旨在提供,也不构成TradingView提供或认可的任何形式的财务、投资、交易或其他类型的建议或推荐。请阅读使用条款了解更多信息。