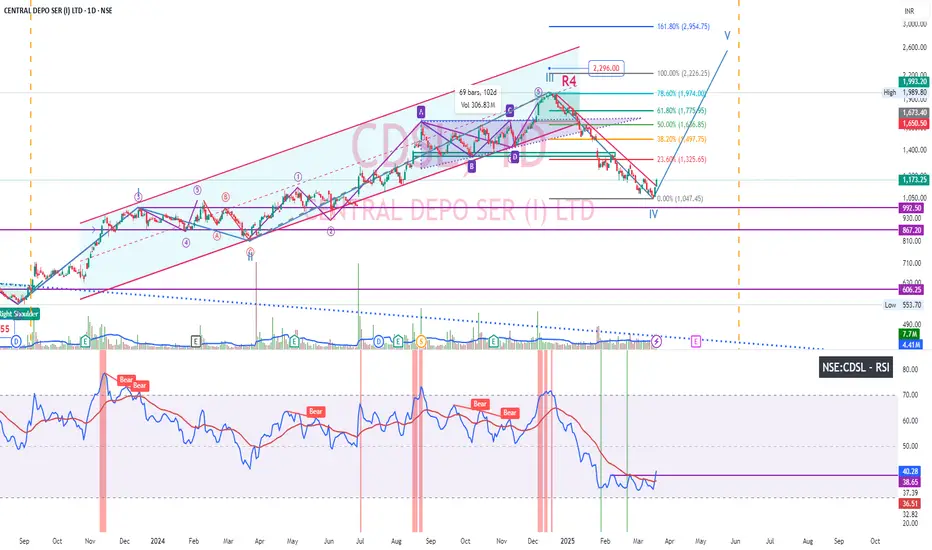
CDSL after reaching ascending triangle target exited parallel channel and corrected 37% and now taking up bullish reversal. Could see breakout in price chart of Daily timeframe. Also RSI breaking out after base formation. Weekly chart Bullish engulfing candlestick pattern.
交易开始
Increased position注释
CDSL if you've observed, it has bottomed out at bad results meaning market factored it. Hence didn't correct much on result day. Riding final wave免责声明
这些信息和出版物并非旨在提供,也不构成TradingView提供或认可的任何形式的财务、投资、交易或其他类型的建议或推荐。请阅读使用条款了解更多信息。