Late Published "Only for Educational Purpose"
📊 Pattern Formation: Bullish Cup and Handle
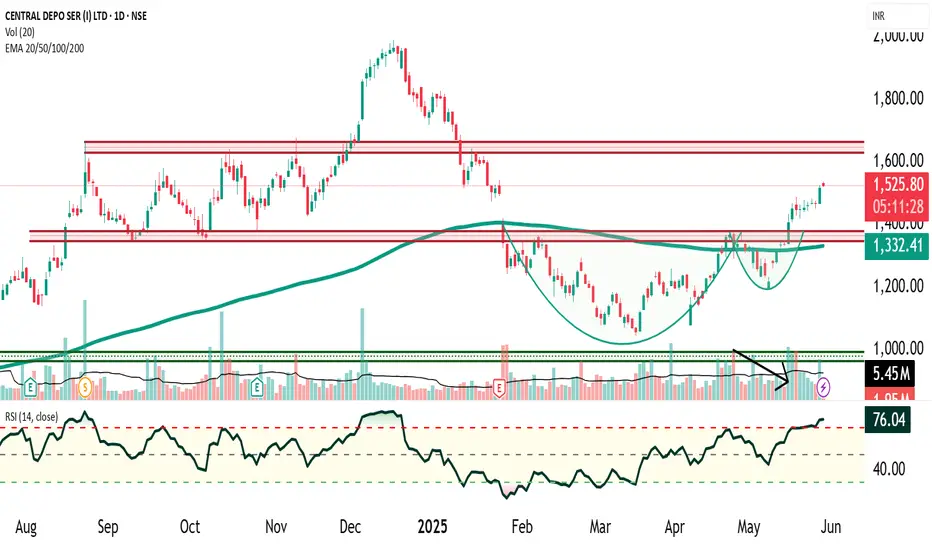
CDSL has officially broken out of a Bullish Cup and Handle chart pattern, signaling a strong technical breakout with high probability of an extended uptrend. This classic bullish continuation pattern took 4 months to form, indicating a well-developed structure with strong base formation.
📈 Volume & Momentum Indicators
✅ Volume Surge: Confirmed breakout with significant increase in volume — a clear sign of institutional buying
✅ RSI (Relative Strength Index): Currently above 60, indicating strong bullish momentum and room for further upside
✅ Price > 200 EMA: Signals that CDSL is in a confirmed long-term uptrend; the price holding above the 200-day exponential moving average is a strong bullish sign
🎯 Price Target Calculation – Cup and Handle Measurement Rule
Measurement Rule Target:
📌 Target Price = Neckline + Depth of Cup
🛡️ Stop-Loss (Risk Management)
Choose between Conservative and Aggressive exit strategies:
🔥 Trending Takeaways
CDSL is exhibiting a bullish breakout setup with volume confirmation, strong RSI, and price above 200 EMA. This combination often precedes explosive price action and potential multi-week rally.
🚀 #CDSLBreakout #CupAndHandle #BullishBreakout #TechnicalAnalysis #StockMarketIndia #SwingTrading #MomentumStocks #NSEStocks #ChartPatterns #VolumeAnalysis #StockMarketNews #RSI60 #200EMA #BreakoutStocks #PriceActionTrading
📊 Pattern Formation: Bullish Cup and Handle
CDSL has officially broken out of a Bullish Cup and Handle chart pattern, signaling a strong technical breakout with high probability of an extended uptrend. This classic bullish continuation pattern took 4 months to form, indicating a well-developed structure with strong base formation.
- Neckline Resistance: ₹1380
- Breakout Confirmation: Occurred with rising volume, confirming buyer participation
- Handle Formation: Characterized by a pullback on declining volume, a textbook sign of weak selling pressure and consolidation before a breakout
📈 Volume & Momentum Indicators
✅ Volume Surge: Confirmed breakout with significant increase in volume — a clear sign of institutional buying
✅ RSI (Relative Strength Index): Currently above 60, indicating strong bullish momentum and room for further upside
✅ Price > 200 EMA: Signals that CDSL is in a confirmed long-term uptrend; the price holding above the 200-day exponential moving average is a strong bullish sign
🎯 Price Target Calculation – Cup and Handle Measurement Rule
Measurement Rule Target:
📌 Target Price = Neckline + Depth of Cup
- Neckline: ₹1380
- Bottom of Cup (approx.): ₹1180
- Cup Depth = ₹1380 - ₹1180 = ₹200
- ➡️ Projected Target = ₹1380 + ₹200 = ₹1580
🛡️ Stop-Loss (Risk Management)
Choose between Conservative and Aggressive exit strategies:
- Conservative SL: Below the lowest low of the handle (approx. ₹1290)
- Aggressive SL: Below the breakout candle low (approx. ₹1345)
🔥 Trending Takeaways
CDSL is exhibiting a bullish breakout setup with volume confirmation, strong RSI, and price above 200 EMA. This combination often precedes explosive price action and potential multi-week rally.
🚀 #CDSLBreakout #CupAndHandle #BullishBreakout #TechnicalAnalysis #StockMarketIndia #SwingTrading #MomentumStocks #NSEStocks #ChartPatterns #VolumeAnalysis #StockMarketNews #RSI60 #200EMA #BreakoutStocks #PriceActionTrading
免责声明
这些信息和出版物并不意味着也不构成TradingView提供或认可的金融、投资、交易或其它类型的建议或背书。请在使用条款阅读更多信息。
免责声明
这些信息和出版物并不意味着也不构成TradingView提供或认可的金融、投资、交易或其它类型的建议或背书。请在使用条款阅读更多信息。