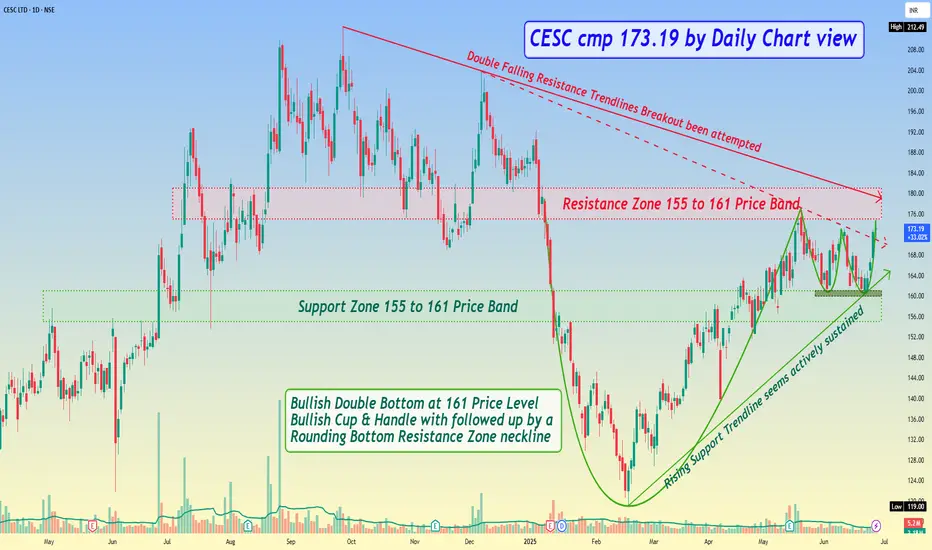
*CESC cmp 173.19 by Daily Chart view*
- Support Zone 155 to 161 Price Band
- Resistance Zone 155 to 161 Price Band
- Bullish Double Bottom at 161 Price Level
- Rising Support Trendline seems actively sustained
- Volumes spiking seen in sync with the avg traded quantity
- Double Falling Resistance Trendlines Breakout been attempted
- Bullish Cup & Handle with followed up by a Rounding Bottom Resistance Zone neckline
免责声明
这些信息和出版物并非旨在提供,也不构成TradingView提供或认可的任何形式的财务、投资、交易或其他类型的建议或推荐。请阅读使用条款了解更多信息。