CHOLAFIN- Cup & Handle Breakout with Strong Fundamentals
CHOLAFIN – Cup & Handle Breakout with Strong Fundamentals ☕📈
📅 Published on: April 17, 2025
📊 Technical Analysis:
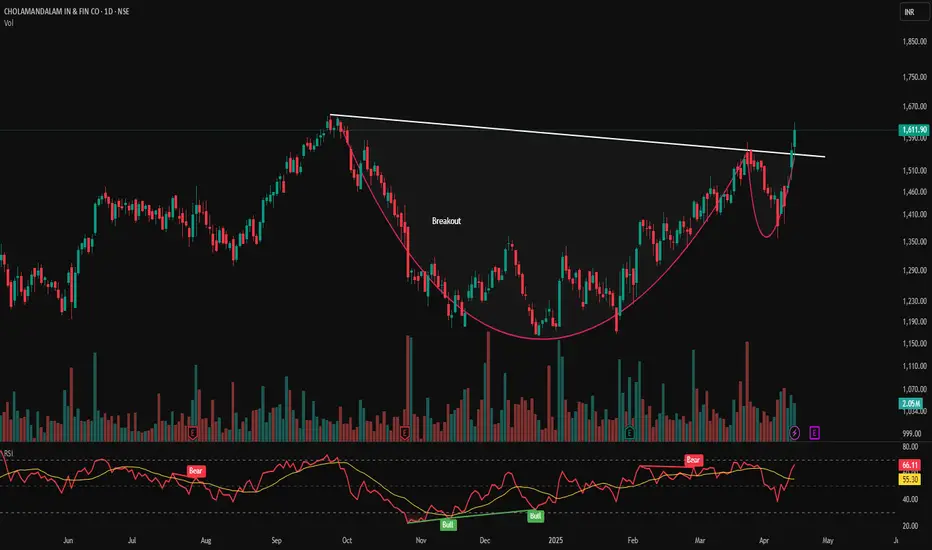
CHOLAFIN has formed a classic Cup & Handle pattern on the daily chart, indicating a potential bullish continuation. The breakout above the neckline is accompanied by increased volume, suggesting strong buying interest.
Pattern: Cup & Handle
Neckline Breakout Level: ₹1,570
Current Price: ₹1,611.90 (+3.31%)
Volume: 2.05M—significant increase confirming breakout
Support & Resistance Levels:
Immediate Support: ₹1,570
Next Support: ₹1,500
Resistance Levels:
Indicators:
RSI: 66.11—approaching overbought territory, indicating strong momentum
MACD: Bullish crossover observed, supporting upward movement
🏢 Fundamental Analysis:
Cholamandalam Investment and Finance Company Ltd. is a leading NBFC in India, operating in vehicle finance, home loans, and corporate finance sectors.
Key Financial Metrics:
Recent Performance:
Net Profit Margin: 18.16%
Return on Assets: 2.18%
Asset Turnover Ratio: 0.14
The company has demonstrated consistent profit growth over the past five years, with a CAGR of 23.4%.
📌 Trade Strategy (For Educational Purposes):
Entry Point: ₹1,570–₹1,600 (on retest)
Stop Loss: ₹1,500
Target Levels:
📍 Visual Elements:
🔔 Disclaimer: This analysis is for educational purposes only. Please conduct your own research or consult a financial advisor before making investment decisions.
📅 Published on: April 17, 2025
📊 Technical Analysis:
CHOLAFIN has formed a classic Cup & Handle pattern on the daily chart, indicating a potential bullish continuation. The breakout above the neckline is accompanied by increased volume, suggesting strong buying interest.
Pattern: Cup & Handle
Neckline Breakout Level: ₹1,570
Current Price: ₹1,611.90 (+3.31%)
Volume: 2.05M—significant increase confirming breakout
Support & Resistance Levels:
Immediate Support: ₹1,570
Next Support: ₹1,500
Resistance Levels:
- ₹1,635
- ₹1,680
- ₹1,750
Indicators:
RSI: 66.11—approaching overbought territory, indicating strong momentum
MACD: Bullish crossover observed, supporting upward movement
🏢 Fundamental Analysis:
Cholamandalam Investment and Finance Company Ltd. is a leading NBFC in India, operating in vehicle finance, home loans, and corporate finance sectors.
Key Financial Metrics:
- Market Cap: ₹1,20,302 Cr
- PE Ratio: 29.60
- PB Ratio: 5.62
- ROE: 17.41%
- ROCE: 11.23%
- Dividend Yield: 0.14%
Recent Performance:
Net Profit Margin: 18.16%
Return on Assets: 2.18%
Asset Turnover Ratio: 0.14
The company has demonstrated consistent profit growth over the past five years, with a CAGR of 23.4%.
📌 Trade Strategy (For Educational Purposes):
Entry Point: ₹1,570–₹1,600 (on retest)
Stop Loss: ₹1,500
Target Levels:
- ₹1,635
- ₹1,680
- ₹1,750
📍 Visual Elements:
- Cup & Handle pattern highlighted
- Breakout point marked
- Support and resistance levels indicated
- Volume bars showing increased activity
- RSI and MACD indicators displayed
🔔 Disclaimer: This analysis is for educational purposes only. Please conduct your own research or consult a financial advisor before making investment decisions.
交易结束:到达目标
The first resistance level has been touched. If the trend is to continue, it's important to follow a trailing stop-loss strategy and patiently wait for the price to approach the second resistance level.免责声明
这些信息和出版物并非旨在提供,也不构成TradingView提供或认可的任何形式的财务、投资、交易或其他类型的建议或推荐。请阅读使用条款了解更多信息。
免责声明
这些信息和出版物并非旨在提供,也不构成TradingView提供或认可的任何形式的财务、投资、交易或其他类型的建议或推荐。请阅读使用条款了解更多信息。