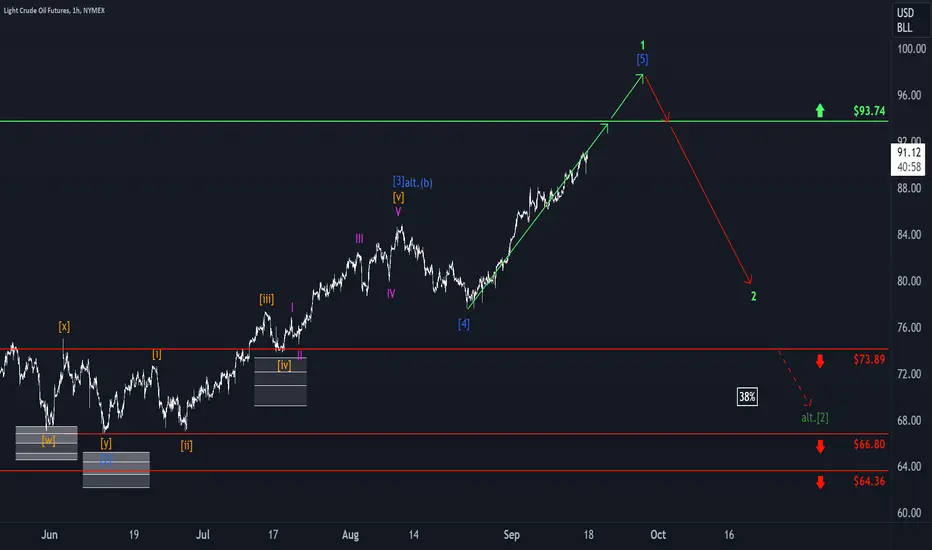
WTI is riding a robust bullish wave, propelling it to its highest levels in 10 months. In our analysis, we anticipate that, to complete the blue wave [5], it must surpass the resistance at $93.74. Subsequently, a noteworthy descent is in the cards. It’s essential to note that a dip below $73.89, though with a 38% probability in our estimation, signifies a further decline within the green wave alt.[2].
📊 Free daily market insights combining macro + Elliott Wave analysis
🚀 Spot trends early with momentum, sentiment & price structure
🌐 Join thousands trading smarter - full free analyses at dailymarketupdate.com
🚀 Spot trends early with momentum, sentiment & price structure
🌐 Join thousands trading smarter - full free analyses at dailymarketupdate.com
相关出版物
免责声明
这些信息和出版物并不意味着也不构成TradingView提供或认可的金融、投资、交易或其它类型的建议或背书。请在使用条款阅读更多信息。