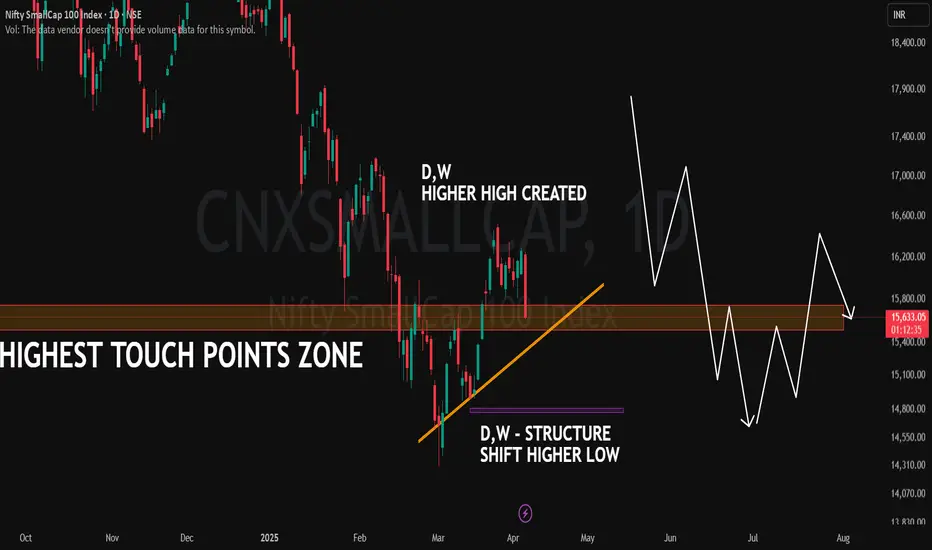
📊 Index: Nifty SmallCap 100 (NSE)
📉 CMP: 15,633 (-3.22%)
Chart Breakdown:
🔶 Highest Touch Points Zone: A key historical level where price has reacted multiple times.
📈 Higher High Created (D,W): Price has formed a higher high on both daily and weekly timeframes, indicating a shift in structure.
🟠 Trendline Support (Orange Line): A rising trendline acting as dynamic support.
🟣 Higher Low Structure (D,W): A significant shift where a higher low was established on daily and weekly charts.
The price is currently interacting with a crucial zone, making it a significant area to observe.
🎯 Master My Self-Made Trading Strategy
📈 Telegram (Learn Today): t.me/hashtaghammer
✅ WhatsApp (Learn Today): wa.me/919455664601
📈 Telegram (Learn Today): t.me/hashtaghammer
✅ WhatsApp (Learn Today): wa.me/919455664601
相关出版物
免责声明
这些信息和出版物并非旨在提供,也不构成TradingView提供或认可的任何形式的财务、投资、交易或其他类型的建议或推荐。请阅读使用条款了解更多信息。