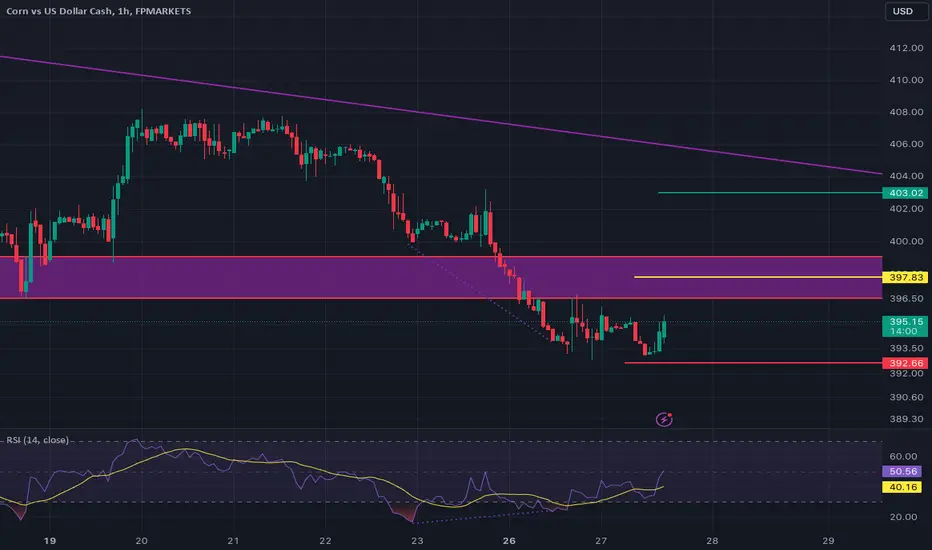
Corn analysis is done on an hourly chart. There is a bullish divergence on an hourly chart with a formation of double bottom reversal pattern. Placed an entry on the previous LH with SL placed just below the double bottom.
The Signal is:
EP: 397.83
SL: 392.66
TP: 403.00
The Signal is:
EP: 397.83
SL: 392.66
TP: 403.00
免责声明
这些信息和出版物并不意味着也不构成TradingView提供或认可的金融、投资、交易或其它类型的建议或背书。请在使用条款阅读更多信息。
免责声明
这些信息和出版物并不意味着也不构成TradingView提供或认可的金融、投资、交易或其它类型的建议或背书。请在使用条款阅读更多信息。