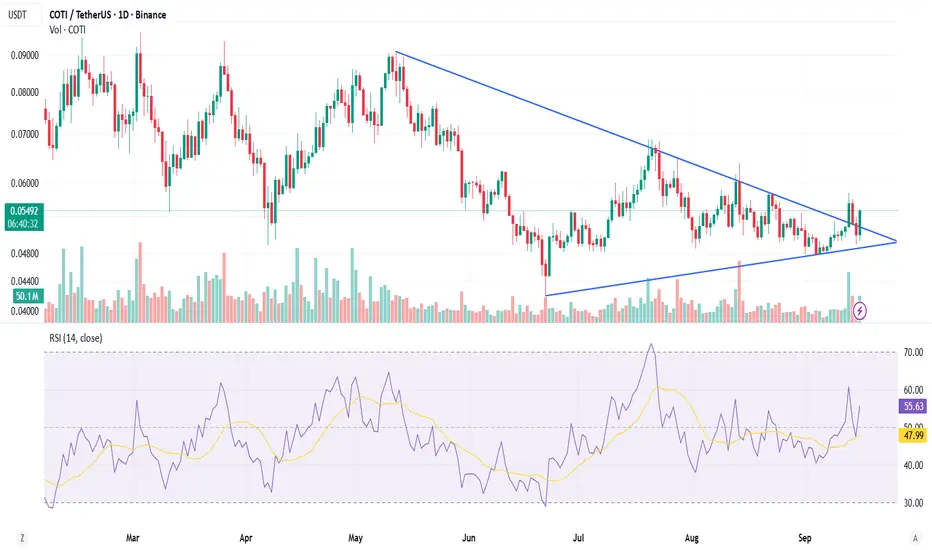
COTI has been consolidating inside a symmetrical triangle for several months, with lower highs and higher lows squeezing the price action.
🔎 Key Observations
Price has now broken out of the triangle resistance with a strong green daily candle.
Volume increased significantly on the breakout, confirming buyer participation.
RSI (14) is at 55.9, trending upward and above the neutral 50 mark, showing improving momentum.
Price is currently trading at $0.0551, above the key breakout zone around $0.052 – $0.053.
📊 Bullish Scenario
Holding above $0.052 keeps the breakout valid.
First resistance: $0.060
Next resistance: $0.070 (major psychological level).
Break and close above $0.070 could open the path toward $0.080 – $0.090.
⚠️ Bearish Scenario
If price falls back below $0.052, it may re-enter the triangle range.
Key supports:
$0.050 – $0.048
$0.045 (triangle base and crucial support)
A breakdown below $0.045 would invalidate the bullish setup.
免责声明
这些信息和出版物并不意味着也不构成TradingView提供或认可的金融、投资、交易或其它类型的建议或背书。请在使用条款阅读更多信息。
免责声明
这些信息和出版物并不意味着也不构成TradingView提供或认可的金融、投资、交易或其它类型的建议或背书。请在使用条款阅读更多信息。