📉 🔴
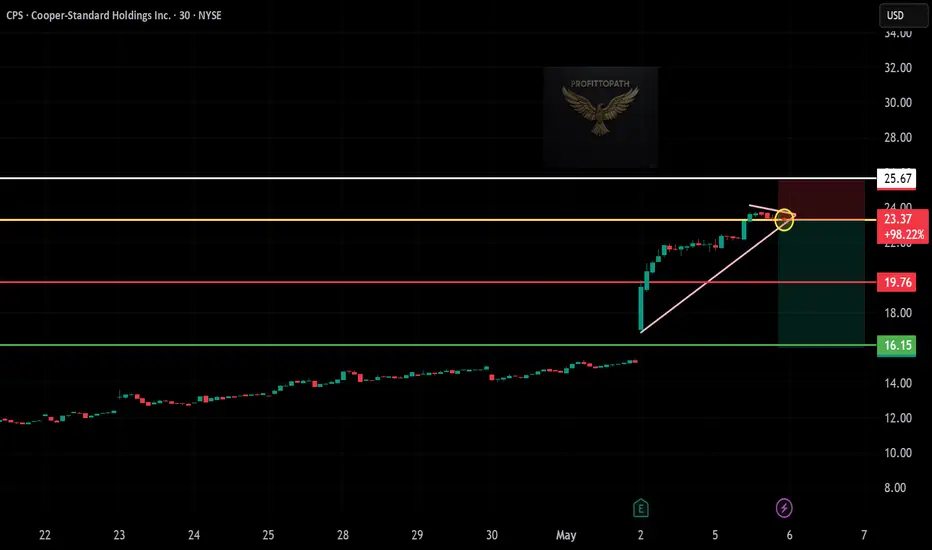
Ticker: CPS (Cooper-Standard Holdings Inc., NYSE: CPS)
Chart: 30-Minute Timeframe
Pattern: Rising wedge breakdown + trendline rejection
🔻 Entry: $23.37 (break below wedge + resistance rejection)
🔻 Stop-Loss: $25.67 (above wedge breakdown and structure)
🔻 Take Profits:
• TP1: $19.76 – First support zone
• TP2: $16.15 – Measured wedge breakdown target
⚖️ Risk-Reward:
• Risk/Share: $2.30
• Reward to TP2: $7.22
• R:R Ratio: ~1:3.1 ✅
🧠 Technical Highlights:
– Rising wedge pattern broken to downside
– Strong rejection at key resistance (yellow zone)
– Bearish confirmation after breakdown with retest
免责声明
这些信息和出版物并非旨在提供,也不构成TradingView提供或认可的任何形式的财务、投资、交易或其他类型的建议或推荐。请阅读使用条款了解更多信息。
免责声明
这些信息和出版物并非旨在提供,也不构成TradingView提供或认可的任何形式的财务、投资、交易或其他类型的建议或推荐。请阅读使用条款了解更多信息。