Cisco (CSCO) Stock Analysis
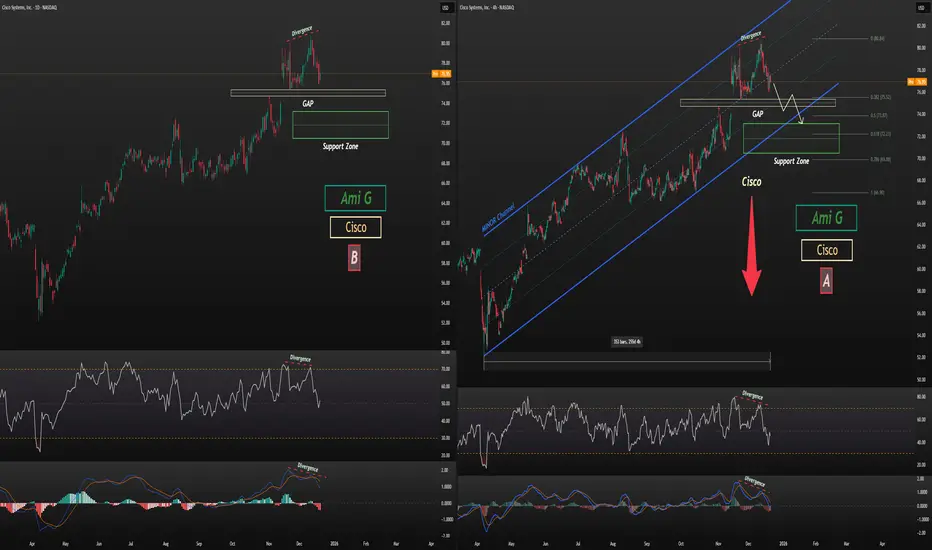
As shown on the chart, Cisco is trading near the upper boundary of its 9-month channel. After forming two strong divergences on the 4H chart (Chart A) and the daily chart (Chart B)—confirmed by both MACD and RSI—the stock has entered a corrective phase.
Given the presence of a very strong gap marked on the chart, price is likely to correct at least toward the gap zone, and potentially extend further to the support zone, which may also align with the lower boundary of the 9-month channel.
Analysis will be updated.
Follow me on TradingView for more analyses and live stock trades.
 CSCO
CSCO
As shown on the chart, Cisco is trading near the upper boundary of its 9-month channel. After forming two strong divergences on the 4H chart (Chart A) and the daily chart (Chart B)—confirmed by both MACD and RSI—the stock has entered a corrective phase.
Given the presence of a very strong gap marked on the chart, price is likely to correct at least toward the gap zone, and potentially extend further to the support zone, which may also align with the lower boundary of the 9-month channel.
Analysis will be updated.
Follow me on TradingView for more analyses and live stock trades.
AG-Precision-Trading
📈 Live Trading: Stocks & Crypto
🔍 Symbol Analysis & Insights
💎 Understanding Relative Asset Values
📈 Live Trading: Stocks & Crypto
🔍 Symbol Analysis & Insights
💎 Understanding Relative Asset Values
免责声明
这些信息和出版物并非旨在提供,也不构成TradingView提供或认可的任何形式的财务、投资、交易或其他类型的建议或推荐。请阅读使用条款了解更多信息。
AG-Precision-Trading
📈 Live Trading: Stocks & Crypto
🔍 Symbol Analysis & Insights
💎 Understanding Relative Asset Values
📈 Live Trading: Stocks & Crypto
🔍 Symbol Analysis & Insights
💎 Understanding Relative Asset Values
免责声明
这些信息和出版物并非旨在提供,也不构成TradingView提供或认可的任何形式的财务、投资、交易或其他类型的建议或推荐。请阅读使用条款了解更多信息。