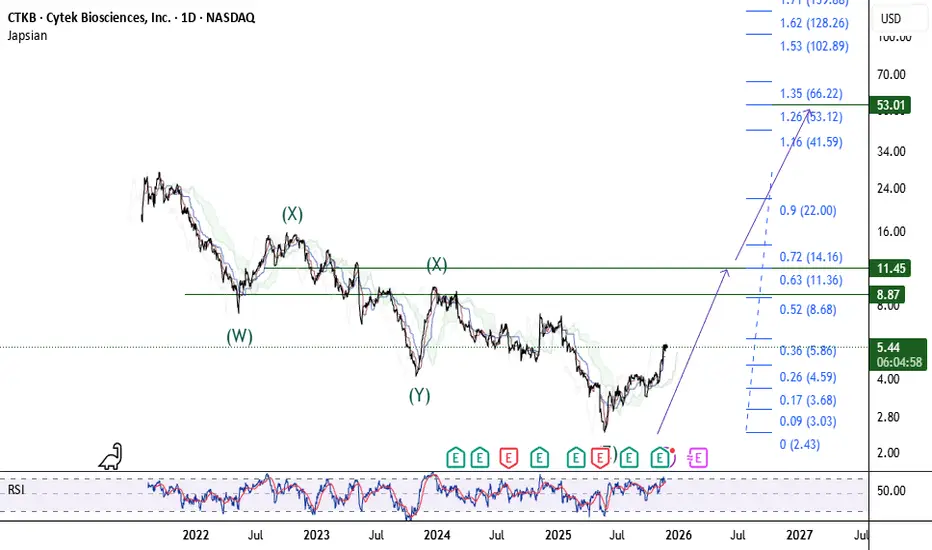
After completing what appears to be a complex corrective structure, this stock seems likely to make a retracement toward at least the 0.63 level (around $11.5) of the entire bearish wave. If it breaks above this zone, the long-term Fibonacci target at 1.26 (around $54) will be activated, which I’ve marked on the chart.
免责声明
这些信息和出版物并非旨在提供,也不构成TradingView提供或认可的任何形式的财务、投资、交易或其他类型的建议或推荐。请阅读使用条款了解更多信息。