Current Chart Structure in CVOPRL:
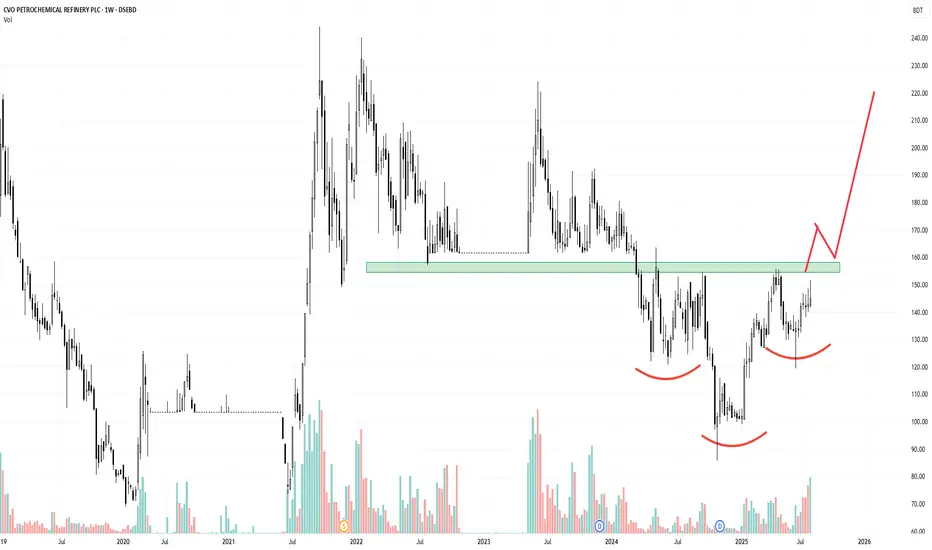
CVOPRL has been in a downtrend, but recently it's showing signs of reversal.
The price has formed a clear inverted head and shoulders pattern.
The neckline resistance is currently being tested.
Volume behavior shows early accumulation, which supports a bullish bias.
Momentum indicators (RSI/MACD) are starting to turn positive, suggesting bullish divergence with price.
Trading Plan & Strategy:
Don’t jump in early. Wait for confirmation.
What to watch for:
Breakout above the neckline with convincing volume.
Retest of the neckline support (previous resistance).
Bullish candle formation (like a hammer, bullish engulfing) during retest.
Entry Point: After a breakout and successful retest confirmation.
免责声明
这些信息和出版物并不意味着也不构成TradingView提供或认可的金融、投资、交易或其它类型的建议或背书。请在使用条款阅读更多信息。
免责声明
这些信息和出版物并不意味着也不构成TradingView提供或认可的金融、投资、交易或其它类型的建议或背书。请在使用条款阅读更多信息。