✅ Key current context
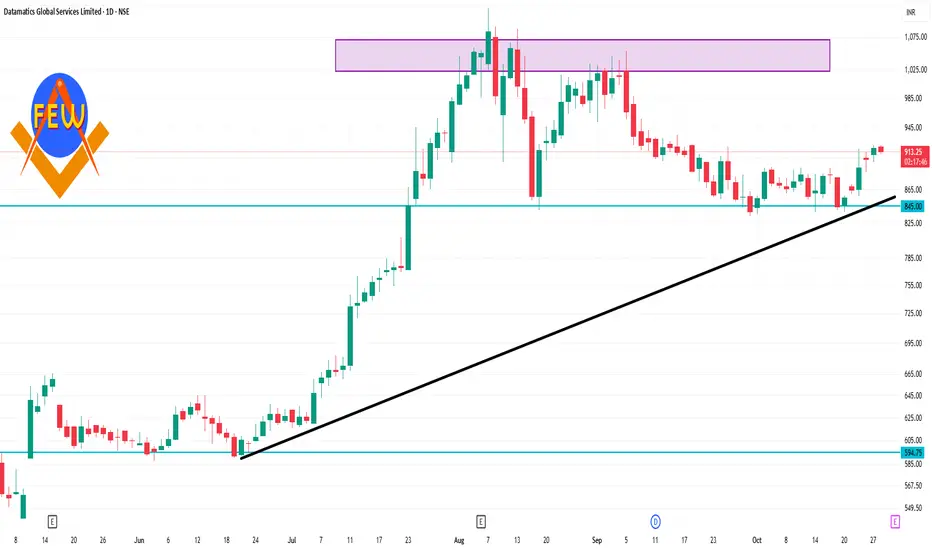
The stock is trading around ₹900-₹915 (last close ~₹903.60).
The 52-week high is ~ ₹1,120, low ~ ₹515.
Short-term momentum indicators show bullish bias: e.g., moving averages across 5, 10, 20, 50, 100, 200 days are all signalling “buy”.
Technical services list daily pivot/support/resistance levels for the stock.
相关出版物
免责声明
这些信息和出版物并非旨在提供,也不构成TradingView提供或认可的任何形式的财务、投资、交易或其他类型的建议或推荐。请阅读使用条款了解更多信息。