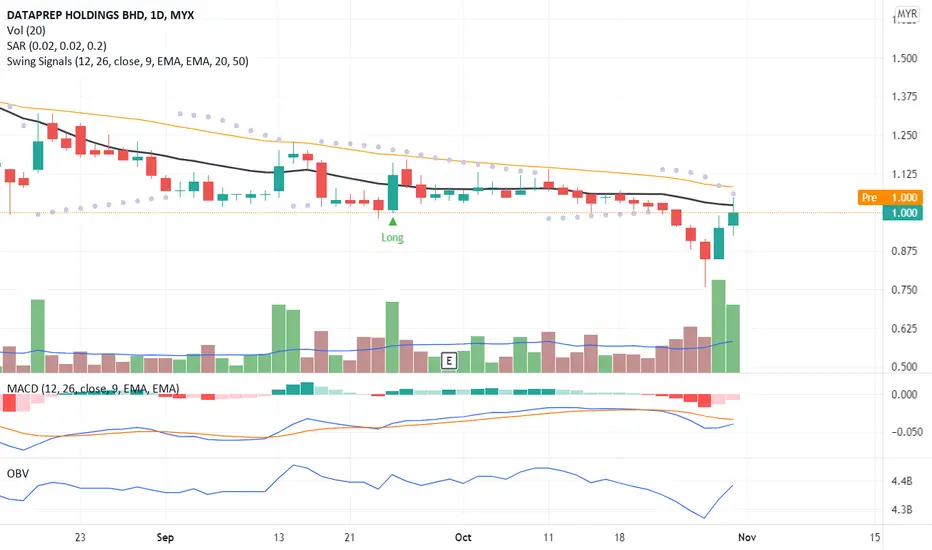
The candlestick indicates a possibility of a divergence signal to become an uptrend pattern. Fibonacci Retracement also confirmed the divergence signal. OBV chart indicates a positive uptrend. MACD chart is still in the weakness signal probability of a divergence. The weekly timeframe is still negative and not suitable for a long trade position. Put DATAPRP in your WL and watch out for price movement above MA20 and the candlestick closed above MA20.
R 1.090
S 0.940
R 1.090
S 0.940
免责声明
这些信息和出版物并非旨在提供,也不构成TradingView提供或认可的任何形式的财务、投资、交易或其他类型的建议或推荐。请阅读使用条款了解更多信息。
免责声明
这些信息和出版物并非旨在提供,也不构成TradingView提供或认可的任何形式的财务、投资、交易或其他类型的建议或推荐。请阅读使用条款了解更多信息。