Use this as a guide to develop your view of the situation.
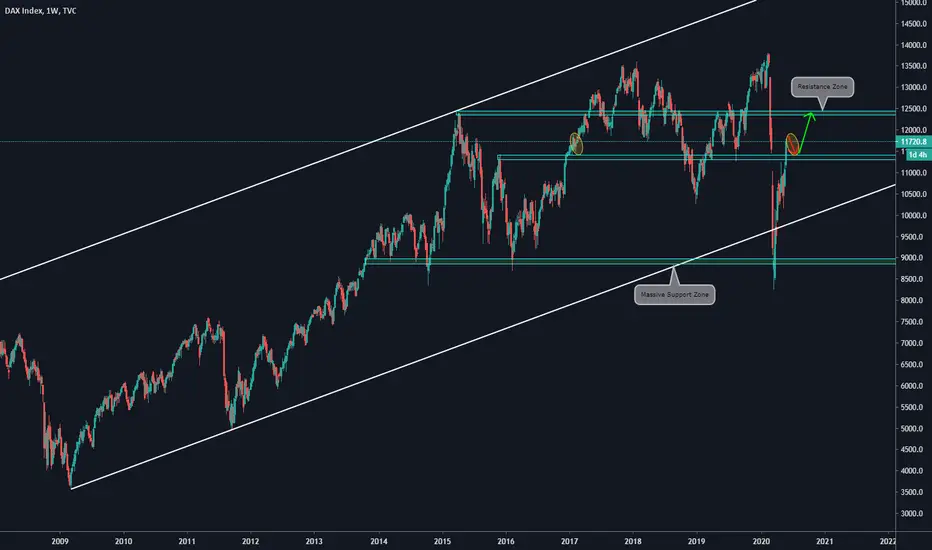
Main items we can see on the Weekly Chart:
a)The price broke with a bullish movement a previous Resistance Zone
b)Taking a look into the past, we can see a similar bullish movement than the current one
c)Using it as something to copy, we will wait for a correction on the current area
d)After that, we will set a long trade towards 12350
e)Of course, we will develop our setup on a lower timeframe, such as 4hs /1h. Use this chart as an idea of how long you should wait before the movement.
免责声明
这些信息和出版物并不意味着也不构成TradingView提供或认可的金融、投资、交易或其它类型的建议或背书。请在使用条款阅读更多信息。
免责声明
这些信息和出版物并不意味着也不构成TradingView提供或认可的金融、投资、交易或其它类型的建议或背书。请在使用条款阅读更多信息。