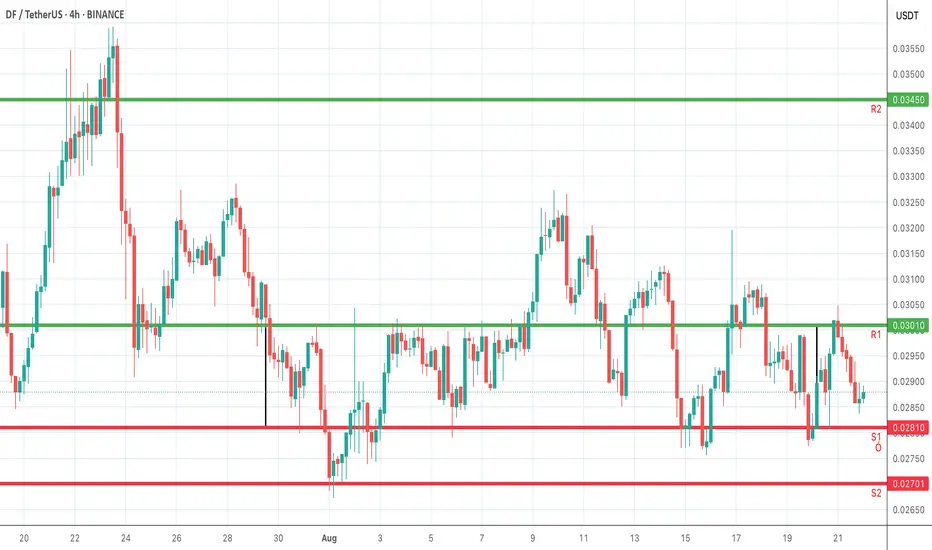
On the 4-hour chart, key support and resistance zones have been plotted. S1 and S2 represent the downside levels where demand could emerge, offering potential rebound points. R1 and R2 indicate resistance barriers on the upside, where selling pressure or profit-taking may appear. Monitoring price action around these levels is crucial: a breakout above resistance suggests bullish continuation, while a breakdown below support could signal further downside. Traders can align entries, exits, and stop-losses with these zones while confirming moves through trend and momentum indicators.
免责声明
这些信息和出版物并不意味着也不构成TradingView提供或认可的金融、投资、交易或其它类型的建议或背书。请在使用条款阅读更多信息。
免责声明
这些信息和出版物并不意味着也不构成TradingView提供或认可的金融、投资、交易或其它类型的建议或背书。请在使用条款阅读更多信息。