two pictures seen in this stock -
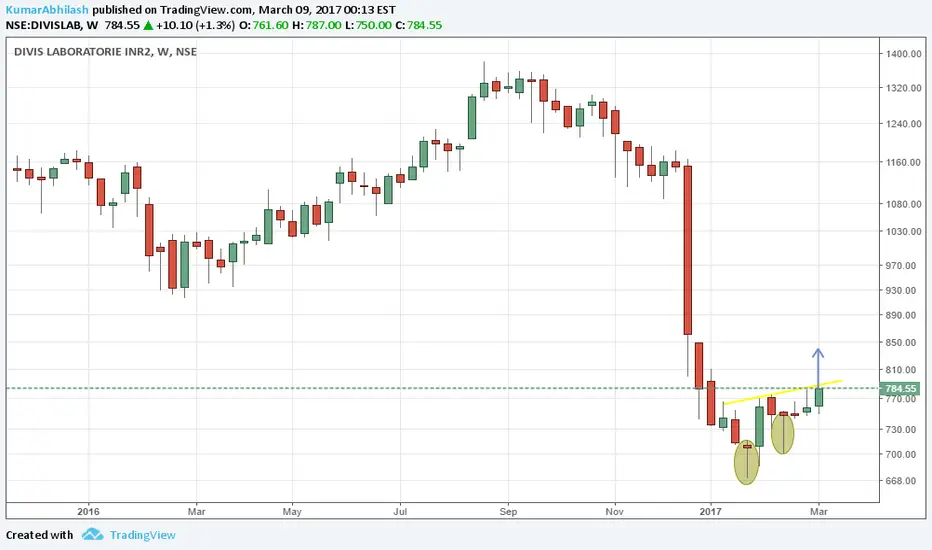
1 . on weekly charts from 2 weeks we r seeing 2 hammer candles, which itself shows a strong demand zone between 660 720 zone .
2 . on daily chart we can see a small traingle setup .

for day traders buy with 780 sl for 830 target
for medium term trader buy for 900 level sl 765
1 . on weekly charts from 2 weeks we r seeing 2 hammer candles, which itself shows a strong demand zone between 660 720 zone .
2 . on daily chart we can see a small traingle setup .
for day traders buy with 780 sl for 830 target
for medium term trader buy for 900 level sl 765
交易手动结束
注释
seems a bull trap(personal view), ignore trade注释
or trade with very tight sl注释
bull got trapped
784 to 754
注释
once again bull got trapped.
its clearly visible on weekly chart that its in extremly bearish trend and flag pattern was in formation which again is a continuation pattern which suggest a downward breakdown which it gave today.
bull trap. it should touch 600 level before any bounce.
KA
免责声明
这些信息和出版物并不意味着也不构成TradingView提供或认可的金融、投资、交易或其它类型的建议或背书。请在使用条款阅读更多信息。