1. Current Market Overview 🌐
The
2. Technical Signals and Momentum Indicators 📊
- Momentum indicators such as MFI, RSI, and Stochastic have all entered the oversold territory, while also showing signs of price compression (consolidation), indicating the market is waiting for the next breakout.
- The strong resistance zone and the Overbought/Overextended (OB/OS) signals suggest that buying pressure is weakening, which is favorable for sellers.
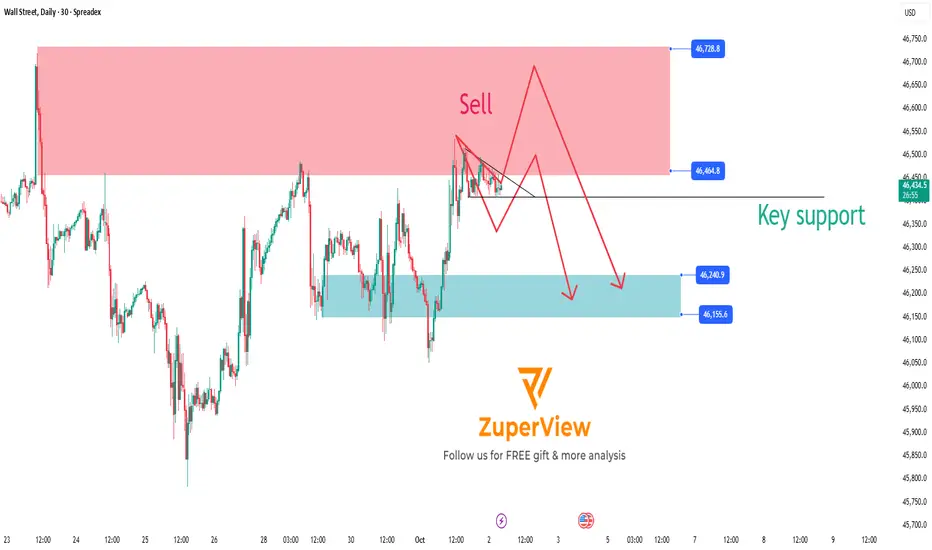
3. Sell Scenario on Key Support Breakdown 🔻
- If the price breaks below the important Key Support level shown on the chart, this will confirm the beginning of a downtrend.
- Traders can consider opening sell positions as soon as the breakout occurs to take advantage of the downward momentum.
- The price target is expected to move toward lower support zones where buying interest may emerge to cause a price correction.
4. Risk Management ⚠️
- Place stop-loss orders above the resistance zone or the nearest recent highs to protect against unexpected market moves.
- Adjust your position size according to your risk tolerance.
5. Conclusion 🔑
- The sell setup on US30 is very clear with a strong resistance zone and momentum signals indicating a potential upcoming downtrend.
- Main scenario: Breaking the Key Support will trigger a strong decline, providing a profitable trading opportunity for sellers.
- Wait for a confirmed support break before entering the trade to ensure safety and effectiveness.
Please like and comment below to support our traders. Your reactions will motivate us to do more analysis in the future 🙏✨
Harry Andrew @ ZuperView
👉 Explore all indicators & systems: zuperview.com/
👉 Join our Discord community: disscord.gg/YKE6ujrw59
Many free indicators will come in the future, stay updated!
👉 Join our Discord community: disscord.gg/YKE6ujrw59
Many free indicators will come in the future, stay updated!
免责声明
这些信息和出版物并不意味着也不构成TradingView提供或认可的金融、投资、交易或其它类型的建议或背书。请在使用条款阅读更多信息。