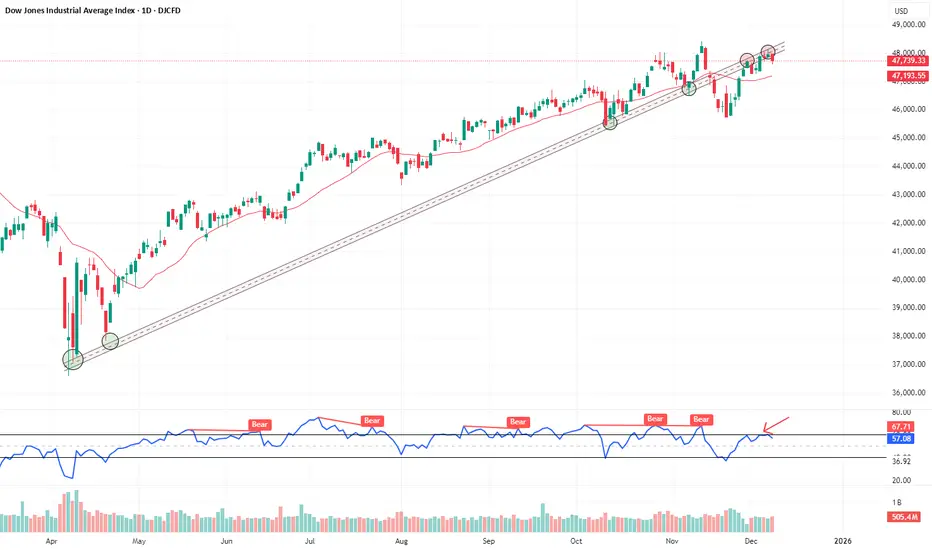
Clear trendline role reversal in play — previous support now acting as strong resistance📉
Price rejection seen near:
🔹 Trendline resistance
🔹 RSI bearish range shift (marked by repeated failures to cross 60)
🔹 Fib 0.786 retracement zone (not shown in chart)
All confluences suggest a potential pause or short-term pullback unless price breaks out with strong volume.
Price rejection seen near:
🔹 Trendline resistance
🔹 RSI bearish range shift (marked by repeated failures to cross 60)
🔹 Fib 0.786 retracement zone (not shown in chart)
All confluences suggest a potential pause or short-term pullback unless price breaks out with strong volume.
免责声明
这些信息和出版物并非旨在提供,也不构成TradingView提供或认可的任何形式的财务、投资、交易或其他类型的建议或推荐。请阅读使用条款了解更多信息。
免责声明
这些信息和出版物并非旨在提供,也不构成TradingView提供或认可的任何形式的财务、投资、交易或其他类型的建议或推荐。请阅读使用条款了解更多信息。