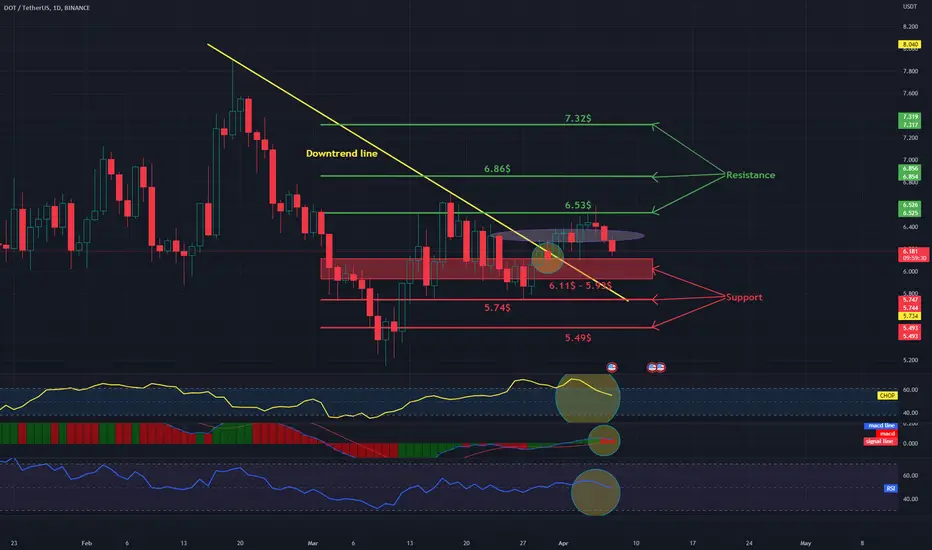
Hello everyone, I invite you to view the DOt/USDT chart on a one-day time frame.. First, we will use the yellow line to mark the downtrend line from which the price went up.
Moving on, we can move on to marking support areas when we start a larger correction. And here we see that the price is just below the first support, then we have a support zone from $6.11 to $5.93 in front of the price, third support at $5.74, and then fourth support at $5.49.
Looking the other way, we see first resistance at $6.53, then second resistance at $6.86, then third resistance at $7.32
Please look at the CHOP index, which indicates that we have a lot of energy for the upcoming move, the MACD indicates that we have entered an uptrend, while the RSI has left the downtrend.
免责声明
这些信息和出版物并不意味着也不构成TradingView提供或认可的金融、投资、交易或其它类型的建议或背书。请在使用条款阅读更多信息。
免责声明
这些信息和出版物并不意味着也不构成TradingView提供或认可的金融、投资、交易或其它类型的建议或背书。请在使用条款阅读更多信息。