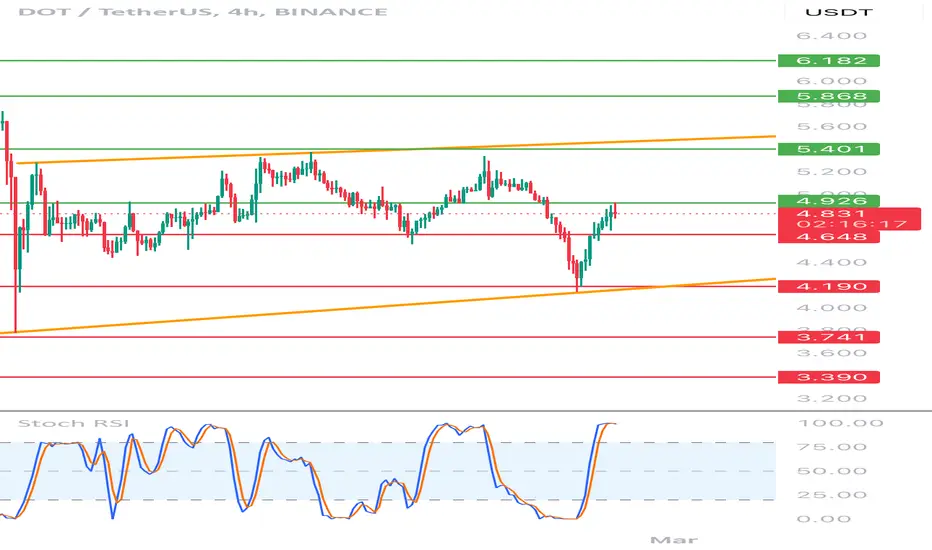
Hello everyone, let's look at the 4H Dot chart to USDT, in this situation we can see how the price moves in the local growth trend channel. However, let's start by defining goals for the near future the price must face:
T1 = $ 4.93
T2 = $ 5.40
Т3 = $ 5.87
T4 = $ 6.18
Let's go to Stop-Loss now in case of further declines on the market:
SL1 = 4.65 $
SL2 = 4.19 $
SL3 = $ 3,74
SL4 = $ 3.39
Looking at the RSI indicator, you can see the traffic above the upper limit of the range in the place where the price relief could be observed earlier.
免责声明
这些信息和出版物并不意味着也不构成TradingView提供或认可的金融、投资、交易或其它类型的建议或背书。请在使用条款阅读更多信息。
免责声明
这些信息和出版物并不意味着也不构成TradingView提供或认可的金融、投资、交易或其它类型的建议或背书。请在使用条款阅读更多信息。