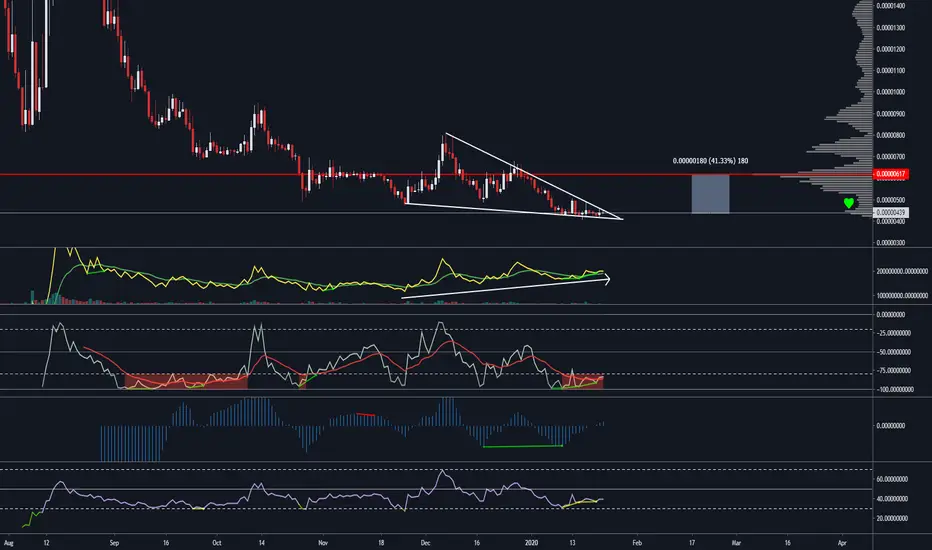
DUSK is setting up for a nice trade despite the bearish market structure. Can the bulls push it up higher? I think it's possible.
My reasoning:
Falling wedge pattern (stockcharts): school.stockcharts.com/doku.php?id=chart_analysis:chart_patterns:falling_wedge_reversal
Hit the LIKE button if you find my analysis valuable and want to support me. Follow to make sure you don't miss any future trade ideas.
My reasoning:
- Structure: Falling wedge chart pattern getting very tight.
- Divergence: Confirmed div in histogram , divs in willy and RSI.
- Volume: OBV is strong, showing a lot more buyers than sellers despite the falling price. Divergence since late November.
- VPVR: Below the POC, however the notch above coupled with the strong volume coming in I think we can fill it.
Falling wedge pattern (stockcharts): school.stockcharts.com/doku.php?id=chart_analysis:chart_patterns:falling_wedge_reversal
Hit the LIKE button if you find my analysis valuable and want to support me. Follow to make sure you don't miss any future trade ideas.
交易开始
交易结束:到达止损
The answer is no! Despite the incredibly bullish setup, there was absolutely no follow through and we lost support once BTC started gaining momentum. An altcoin trader's life ;-)免责声明
这些信息和出版物并不意味着也不构成TradingView提供或认可的金融、投资、交易或其它类型的建议或背书。请在使用条款阅读更多信息。
免责声明
这些信息和出版物并不意味着也不构成TradingView提供或认可的金融、投资、交易或其它类型的建议或背书。请在使用条款阅读更多信息。