📊 Technical Analysis (4H Chart – DXY)
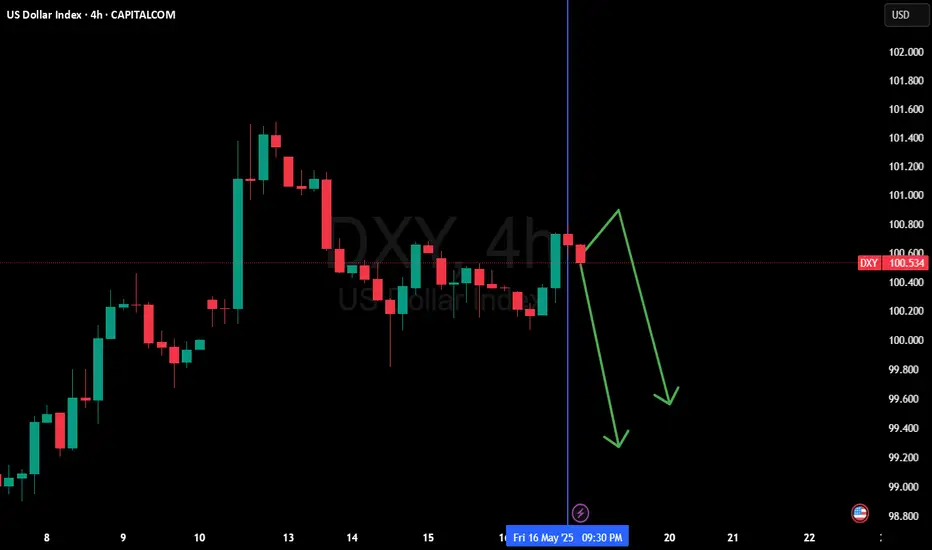
Current Price: ~100.53
Price action shows a rejection from the 100.60–100.80 zone after a minor bullish push. The structure is starting to roll over, and two potential bearish paths are illustrated with arrows heading toward 99.80 and possibly 99.30.
🔍 Key Technical Observations:
Support Zones:
• 99.80 (minor)
• 99.00 – 99.30 (major, previous reversal zone)
Resistance Zones:
• 100.50 – 100.80 (recent rejection zone)
• 101.50 – 102.00 (larger timeframe resistance)
Price appears to be forming a lower high, indicating a possible shift in momentum.
The bearish projection paths suggest potential downside movement unless bulls reclaim control above 100.80.
🔴 Bias:
Bearish short-term unless price reclaims and sustains above 100.80
🌍 Fundamental Outlook for the Week (13–17 May 2025)
🏦 1. Fed Policy Stance
The Fed remains on hold with a data-dependent approach. Persistent inflation and strong jobs data have delayed market expectations for rate cuts—supportive of USD. However, upside may be limited if inflation cools.
📈 2. Key US Data to Watch
CPI (May 15, Wed): Already released. If the print was softer than expected, it may justify the pullback seen on the chart.
Retail Sales (May 16, Thu): Key driver. Weak data could accelerate the drop toward 99.80.
Jobless Claims: Still low, but any uptick may weaken the dollar further.
💹 3. Geopolitics & Risk Sentiment
No significant escalation in global risk events. Risk sentiment remains mixed. If risk appetite strengthens and yields cool off, USD may continue lower.
✅ Conclusion
DXY outlook is bearish near-term if price remains below 100.80.
Expect potential downside toward 99.80 or even 99.30 based on chart structure.
Only a strong shift in data or sentiment (e.g., hawkish Fed remarks or geopolitical tension) could reinstate bullish momentum.
相关出版物
免责声明
这些信息和出版物并非旨在提供,也不构成TradingView提供或认可的任何形式的财务、投资、交易或其他类型的建议或推荐。请阅读使用条款了解更多信息。