Current Price: 100.112
Bias: Bullish short-term
Timeframe: 15-min
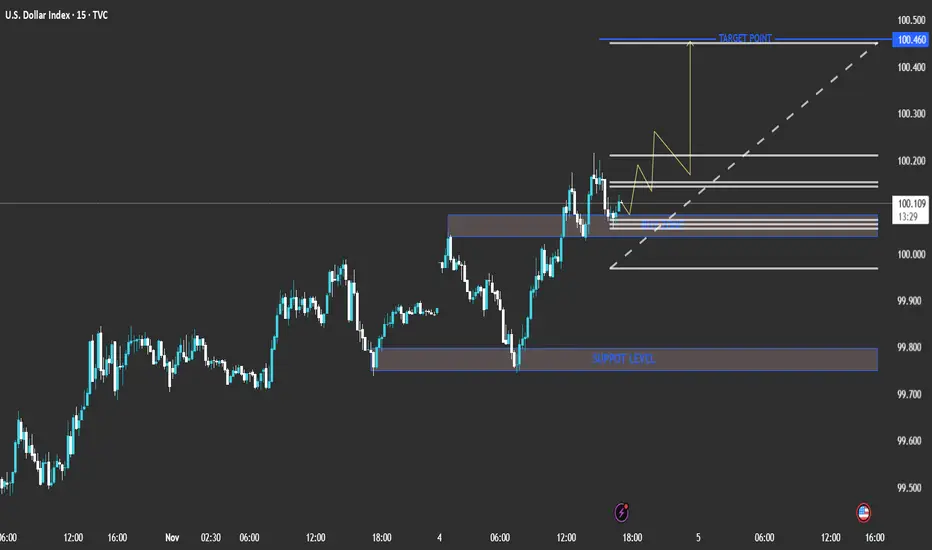
The chart shows a clear bullish structure with higher highs and higher lows forming. The price recently bounced from a minor support zone around the 100.00 level and is showing momentum to the upside.
📊 Key Levels
Support Level: 99.750 – 99.850 (major zone from previous lows)
Buy Zone: 100.000 – 100.050 (minor support/entry zone)
Target Point: 100.460
⚙️ Analysis Summary
Price has broken above short-term resistance and is now retesting the buy zone, suggesting a possible continuation higher.
The ascending trendline (dotted white line) supports this bullish bias.
The yellow zigzag projection indicates expected consolidation before a push upward.
🎯 Trading Plan (Based on Chart Setup)
Entry Zone: Around 100.000 – 100.050
Stop Loss: Below 99.900 (below structure support)
Take Profit: 100.460 (target zone)
Risk/Reward Ratio: Approximately 1:3
🔍 Conclusion
The chart suggests a short-term bullish scenario for DXY (U.S. Dollar Index). A successful bounce from the 100.00 zone could lead to a move toward the 100.46 target point. However, a break below 99.90 would invalidate the setup and shift bias to neutral or bearish. UKX
UKX  UKX
UKX  MCX
MCX  FBMKLCI AIM1
  ASX
ASX  NMX
NMX  AW01 JAPAN GEISAC FBM100
  AIM5 BUK100P XIN0 AXX XIN0U
Bias: Bullish short-term
Timeframe: 15-min
The chart shows a clear bullish structure with higher highs and higher lows forming. The price recently bounced from a minor support zone around the 100.00 level and is showing momentum to the upside.
📊 Key Levels
Support Level: 99.750 – 99.850 (major zone from previous lows)
Buy Zone: 100.000 – 100.050 (minor support/entry zone)
Target Point: 100.460
⚙️ Analysis Summary
Price has broken above short-term resistance and is now retesting the buy zone, suggesting a possible continuation higher.
The ascending trendline (dotted white line) supports this bullish bias.
The yellow zigzag projection indicates expected consolidation before a push upward.
🎯 Trading Plan (Based on Chart Setup)
Entry Zone: Around 100.000 – 100.050
Stop Loss: Below 99.900 (below structure support)
Take Profit: 100.460 (target zone)
Risk/Reward Ratio: Approximately 1:3
🔍 Conclusion
The chart suggests a short-term bullish scenario for DXY (U.S. Dollar Index). A successful bounce from the 100.00 zone could lead to a move toward the 100.46 target point. However, a break below 99.90 would invalidate the setup and shift bias to neutral or bearish.
JOIN MY TELEGRAM
t.me/MR_NRACOS_ANALYSIS
t.me/MR_NRACOS_ANALYSIS
SERVICES AVAILABLE FOR CHANNEL
✓FOREX TRADING ANALYSIS
✓FOREX TRADING IDEA 💡
✓FOREX TRADING SIGNALS XAU USD BTC SUD
✓ PREMIUM CHANNEL
t.me/MR_NRACOS_ANALYSIS
t.me/MR_NRACOS_ANALYSIS
SERVICES AVAILABLE FOR CHANNEL
✓FOREX TRADING ANALYSIS
✓FOREX TRADING IDEA 💡
✓FOREX TRADING SIGNALS XAU USD BTC SUD
✓ PREMIUM CHANNEL
免责声明
这些信息和出版物并不意味着也不构成TradingView提供或认可的金融、投资、交易或其它类型的建议或背书。请在使用条款阅读更多信息。