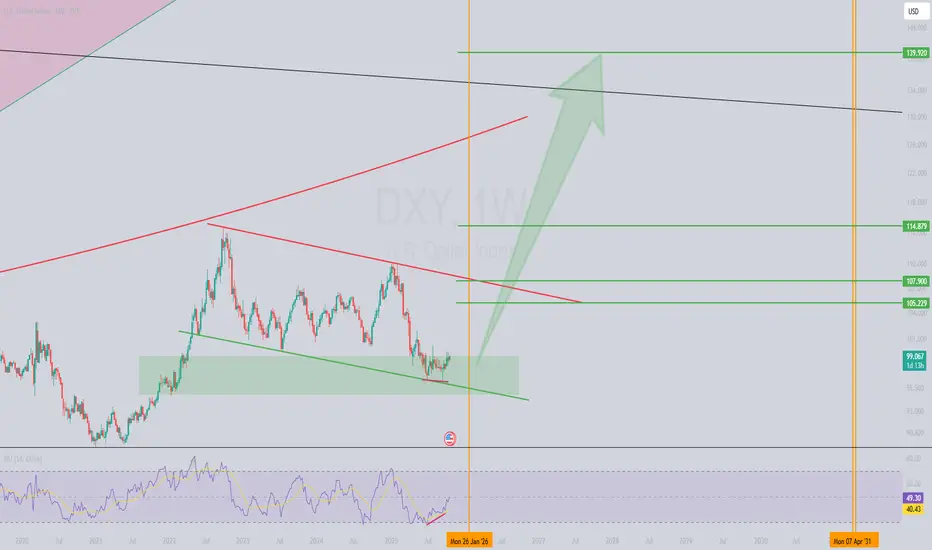
The US Dollar Index (DXY) is showing a compelling setup on the weekly timeframe! 📈 The price has reached a critical support zone between 99.120 and 94.802. This level also aligns with the lower boundary of a descending channel, adding confluence to this high-probability zone.
🔍 Key Technical Observations:
Bullish Divergence: A clear bullish divergence has formed between the price and the RSI indicator, signaling potential exhaustion of sellers and a possible trend reversal.
Channel Support: The price is testing the lower trendline of the descending channel, a spot where buyers have stepped in before.
Support Zone: The 99.120–94.802 range is a high-value area for accumulation, making it a prime spot for a bounce.
📡 What’s Next?Technically, the DXY looks poised for a bullish reversal. However, global macroeconomic events and fundamental news (like Fed decisions or geopolitical developments) will play a crucial role in confirming this move. Keep an eye on upcoming economic data releases! 📅
What do you think of this setup? Are you bullish on DXY, or waiting for more confirmation? Drop your thoughts below! 👇
免责声明
这些信息和出版物并不意味着也不构成TradingView提供或认可的金融、投资、交易或其它类型的建议或背书。请在使用条款阅读更多信息。
免责声明
这些信息和出版物并不意味着也不构成TradingView提供或认可的金融、投资、交易或其它类型的建议或背书。请在使用条款阅读更多信息。