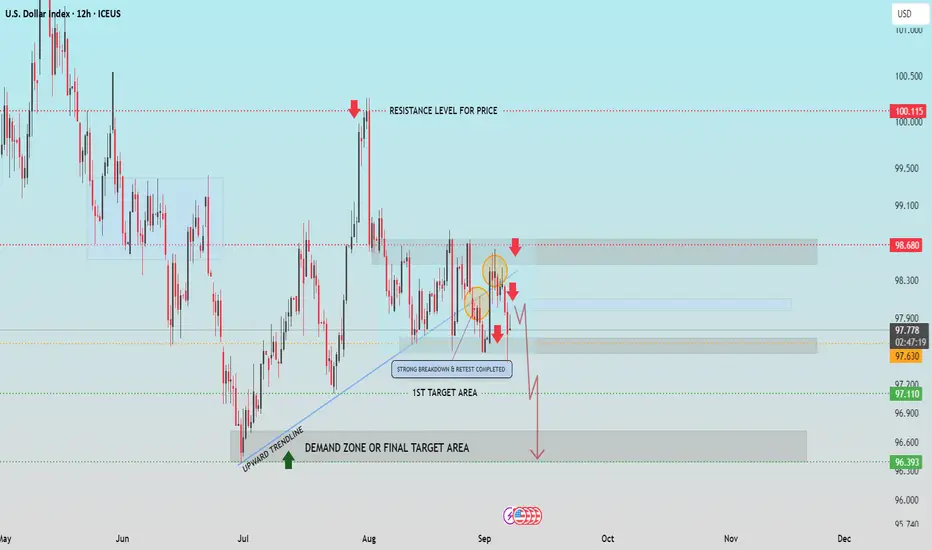
📊 U.S. Dollar Index (DXY) – Technical Analysis
🔼 Resistance Zone (Supply Area): 98.68 – 100.11
* This area has consistently rejected price advances, forming a strong resistance level.
* The recent failed attempt to break above this zone confirms seller dominance.
* The most recent lower high near 98.68 strengthens the bearish structure.
📉 Trendline Breakdown and Retest
* A well-established upward trendline was broken decisively, followed by a clean retest.
* The retest was rejected, confirming it has now turned into resistance.
* This is a classic breakdown-retest-continuation pattern, suggesting further downside.
🎯 First Target Area: 97.10 – 97.21
* This zone is the immediate support level where the price may attempt a bounce.
* If broken, it could trigger increased bearish momentum and open the door to deeper downside targets.
📦 Demand Zone / Final Target: 96.39 – 96.60
* This is the next major support area and potential reversal zone.
* It aligns with previous accumulation and marks a strong demand level.
* Traders should watch for price behavior here, either for a bounce or continuation below.
🔁 Summary & Outlook
* The chart shows a clear bearish structure with lower highs and a trendline breakdown.
* As long as the price stays below 98.68, sellers remain in control.
* A break below 97.10 may accelerate the move toward the final target area near 96.39.
* Price action around the demand zone will be key to determining trend continuation or reversal.
If this helpful for you, press the like button.
交易开始
注释
注释
1st target achieved
注释
set BE , hold for another target
交易结束:到达目标
💸FREE FOREX Signals in Telegram : t.me/FxInsightsHub0
🔹Join Our Telegram Channel, Pure Price Action Based Signals With Chart Analysis.
t.me/FxInsightsHub0
🚀FREE CRYPTO Signals In Telegram: t.me/FxInsightsHub0
🔹Join Our Telegram Channel, Pure Price Action Based Signals With Chart Analysis.
t.me/FxInsightsHub0
🚀FREE CRYPTO Signals In Telegram: t.me/FxInsightsHub0
相关出版物
免责声明
这些信息和出版物并不意味着也不构成TradingView提供或认可的金融、投资、交易或其它类型的建议或背书。请在使用条款阅读更多信息。