💡 Chart Pattern Education
Symmetrical triangles are powerful continuation patterns that form when buyers and sellers reach equilibrium. The converging trendlines create a coiling effect, building pressure for the next major directional move. Studies show 68-75% success rate when traded with proper volume confirmation.
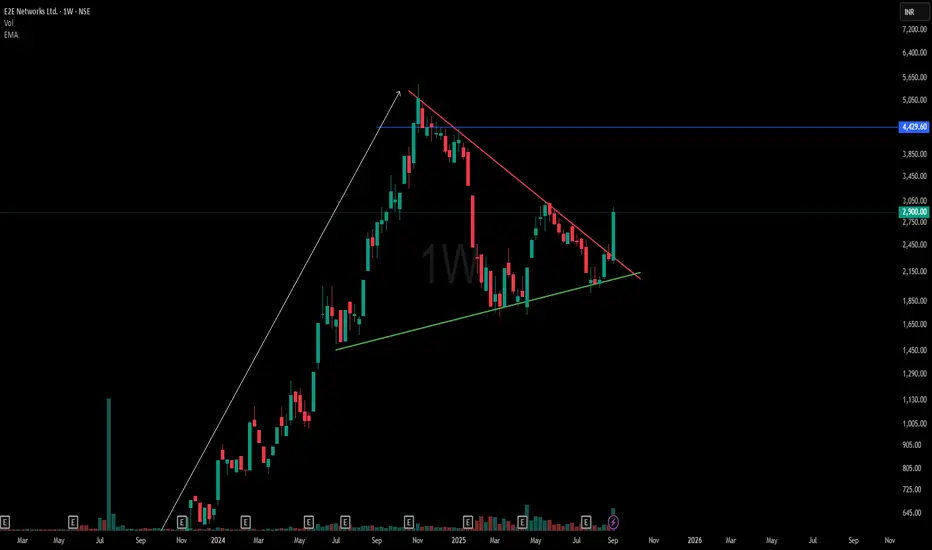
⚡ Matching the Chart shown and the above definition
✅ Higher lows trend intact on support trendline
✅ Lower highs forming clean resistance line
✅ Consolidation phase showing market indecision
✅ Volume declining as expected in triangle patterns
✅ Multiple timeframe confirmation visible
Disclaimer:
This analysis is for educational and informational purposes only and does not constitute financial advice or a recommendation to buy or sell any security. Trading involves risk, and past performance is not indicative of future results. Traders should conduct their own due diligence and consider their risk tolerance before making any trading decisions
Symmetrical triangles are powerful continuation patterns that form when buyers and sellers reach equilibrium. The converging trendlines create a coiling effect, building pressure for the next major directional move. Studies show 68-75% success rate when traded with proper volume confirmation.
⚡ Matching the Chart shown and the above definition
✅ Higher lows trend intact on support trendline
✅ Lower highs forming clean resistance line
✅ Consolidation phase showing market indecision
✅ Volume declining as expected in triangle patterns
✅ Multiple timeframe confirmation visible
Disclaimer:
This analysis is for educational and informational purposes only and does not constitute financial advice or a recommendation to buy or sell any security. Trading involves risk, and past performance is not indicative of future results. Traders should conduct their own due diligence and consider their risk tolerance before making any trading decisions
🎯 Master My Self-Made Trading Strategy
📈 Telegram (Learn Today): t.me/hashtaghammer
✅ WhatsApp (Learn Today): wa.me/919455664601
📈 Telegram (Learn Today): t.me/hashtaghammer
✅ WhatsApp (Learn Today): wa.me/919455664601
相关出版物
免责声明
这些信息和出版物并非旨在提供,也不构成TradingView提供或认可的任何形式的财务、投资、交易或其他类型的建议或推荐。请阅读使用条款了解更多信息。