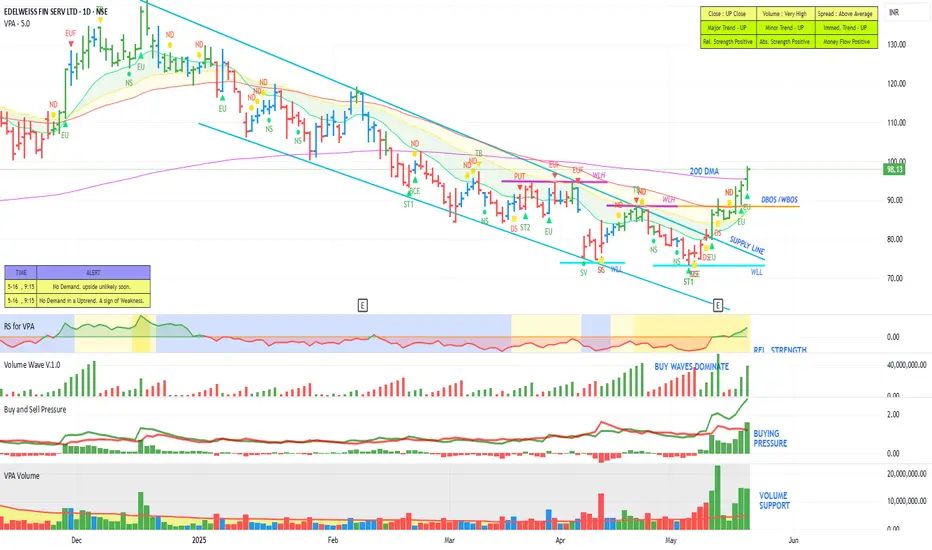
One more interesting chart for study. This stock was pushed down from the top by almost 50%. As you can see, as the stock was dropping, the buy waves were getting stronger and stronger and they started dominating. As you can see, now it seems to be on the recovery path. It has gone above the supply line and moved past the short-term moving averages and also the 200 DMA. We can see marked increase in the buying pressure. Also, there is a very good volume support coming here. The Relative Strength and Money Flow are positive. Now we can see that there is a break of structure in both daily and weekly as well. The stock seems to be getting ready for a good up move and could see 140 levels as a minimum. But at this juncture, we could see a retest of the 200 DMA levels before moving up further.
免责声明
这些信息和出版物并不意味着也不构成TradingView提供或认可的金融、投资、交易或其它类型的建议或背书。请在使用条款阅读更多信息。
免责声明
这些信息和出版物并不意味着也不构成TradingView提供或认可的金融、投资、交易或其它类型的建议或背书。请在使用条款阅读更多信息。