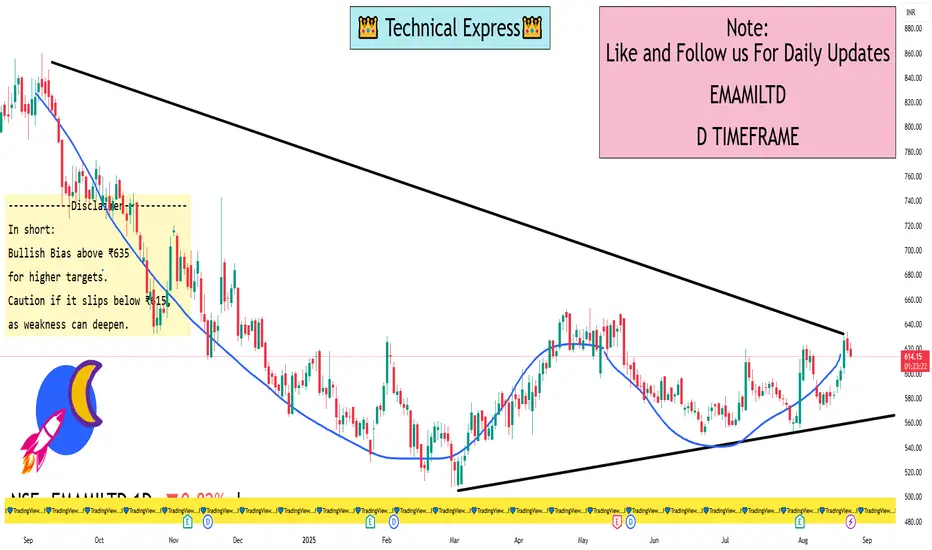
Emami Ltd – Daily Levels
Current Market Structure: Stock is trading in a consolidation range after a recent upward move. Momentum is steady but showing mild profit-booking near resistance.
🔑 Key Levels
Support Zones
₹615 – Strong near-term support, recent demand zone.
₹600 – Major support, breakdown below may invite weakness.
₹585 – Next cushion if selling extends.
Resistance Zones
₹635 – Immediate resistance (recent supply zone).
₹648 – Breakout level; above this stock may gain momentum.
₹660+ – Next bullish target if breakout sustains.
Trend Outlook
Above ₹635 → Momentum buyers may push toward ₹648–660.
Below ₹615 → Weakness may drag it back toward ₹600–585.
📌 Indicators View
Volume: Decreasing, showing consolidation.
RSI (Daily): Near neutral zone (~50–55), showing balanced momentum.
200 DMA: Stock trading comfortably above it, indicating long-term bullishness intact.
I built a Buy & Sell Signal Indicator with 85% accuracy.
📈 Get access via DM or
WhatsApp: wa.link/d997q0
| Email: techncialexpress@gmail.com
| Script Coder | Trader | Investor | From India
📈 Get access via DM or
WhatsApp: wa.link/d997q0
| Email: techncialexpress@gmail.com
| Script Coder | Trader | Investor | From India
相关出版物
免责声明
这些信息和出版物并不意味着也不构成TradingView提供或认可的金融、投资、交易或其它类型的建议或背书。请在使用条款阅读更多信息。