ENA/USDT Chart Analysis | Volatility Signals & Bullish Triggers
🔍 Let’s dive into the ENA/USDT perpetual contract and analyze recent price action, focusing on momentum shifts and key breakout scenarios.
⏳ Daily Overview
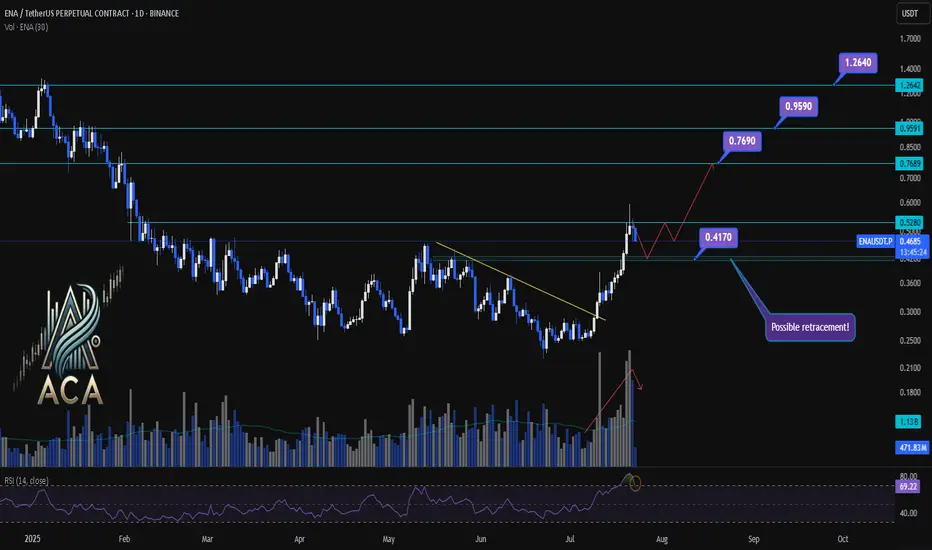
The daily chart shows that ENA recently reentered the overbought zone on the RSI, which can serve as a potential trigger for traders watching momentum shifts. Earlier, price action broke decisively above a long-standing descending trendline, resulting in a rapid, nearly 100% surge, a classic RR2 move off the trendline. This breakout coincided with a visible uptick in trading volume, confirming strong demand behind the move.
Now, during the ensuing rest or correction phase, trading volume is decreasing—often a constructive sign suggesting either profit-taking or a healthy pullback rather than panic selling.
🔺 Bullish Trigger & Setup:
- RSI Signal: Reentry into the RSI overbought zone is a potential long trigger, especially if confirmed by price action.
- Confirmation Level: A daily close with strong volume above $0.528 would add conviction to a bullish setup.
- Trendline Reference: The break above the recent trendline fueled the rapid advance, showing the importance of watching such key resistance levels.
📊 Key Targets (on further bullish confirmation):
- $0.769 — First upside resistance.
- $0.959 — Next bullish target.
- $1.264 — Extension target if momentum continues and broader market sentiment remains supportive.
🚨 Conclusion:
Eyes are on the $0.528 level—closing above it with volume, especially while RSI holds in the overbought zone, could provide the next strong entry signal. Current declining volume during pullbacks suggests this is likely a profit-taking phase or standard correction, not bearish capitulation. Keep monitoring RSI, volume profile, and price closes for the next actionable opportunity.
🔍 Let’s dive into the ENA/USDT perpetual contract and analyze recent price action, focusing on momentum shifts and key breakout scenarios.
⏳ Daily Overview
The daily chart shows that ENA recently reentered the overbought zone on the RSI, which can serve as a potential trigger for traders watching momentum shifts. Earlier, price action broke decisively above a long-standing descending trendline, resulting in a rapid, nearly 100% surge, a classic RR2 move off the trendline. This breakout coincided with a visible uptick in trading volume, confirming strong demand behind the move.
Now, during the ensuing rest or correction phase, trading volume is decreasing—often a constructive sign suggesting either profit-taking or a healthy pullback rather than panic selling.
🔺 Bullish Trigger & Setup:
- RSI Signal: Reentry into the RSI overbought zone is a potential long trigger, especially if confirmed by price action.
- Confirmation Level: A daily close with strong volume above $0.528 would add conviction to a bullish setup.
- Trendline Reference: The break above the recent trendline fueled the rapid advance, showing the importance of watching such key resistance levels.
📊 Key Targets (on further bullish confirmation):
- $0.769 — First upside resistance.
- $0.959 — Next bullish target.
- $1.264 — Extension target if momentum continues and broader market sentiment remains supportive.
🚨 Conclusion:
Eyes are on the $0.528 level—closing above it with volume, especially while RSI holds in the overbought zone, could provide the next strong entry signal. Current declining volume during pullbacks suggests this is likely a profit-taking phase or standard correction, not bearish capitulation. Keep monitoring RSI, volume profile, and price closes for the next actionable opportunity.
免责声明
The information and publications are not meant to be, and do not constitute, financial, investment, trading, or other types of advice or recommendations supplied or endorsed by TradingView. Read more in the Terms of Use.
免责声明
The information and publications are not meant to be, and do not constitute, financial, investment, trading, or other types of advice or recommendations supplied or endorsed by TradingView. Read more in the Terms of Use.