Analyzing Today’s Sharp Market Decline
The significant selloff observed today was not an arbitrary event. The day began with a robust rally following another impressive earnings report in the AI-chip sector, which propelled futures sharply upward and triggered a short squeeze in the Nasdaq. However, the release of a stronger-than-anticipated jobs report shifted the market's sentiment. While hiring showed signs of rebounding, the unemployment rate also ticked higher, undermining the prevailing narrative that the Federal Reserve would soon lower interest rates.
This development served as a stark reminder of the ongoing restrictive monetary policy, coupled with slowing economic growth and exorbitant valuations in the tech sector. Major investment funds capitalized on the morning’s strength in AI and large-cap stocks as an opportunity to reduce their risk exposure. Additionally, systematic trend-followers faced compulsion to sell once the S&P 500 fell below critical support levels.
The environment for high-beta assets, including cryptocurrencies, is already in a “reset” phase, which left little incentive for dip-buying at lower price points. As the E-mini S&P 500 futures broke through the previous day’s support levels, the situation escalated into a full liquidation. This perfect storm involved trapped long positions from the morning breakout, stop-loss orders falling into execution beneath yesterday’s lows, and mechanical selling, culminating in the largest intraday reversal since the spring.
Market Outlook
The current market sentiment is skewed bearish as the ES remains entrenched below the critical 6,660 to 6,700 range. The price is hovering near a significant demand zone established around the lows of the previous trading day and today’s New York session. While we can expect some upward bounces, these movements appear to be temporary rallies within an ongoing downtrend, rather than indicators of a potential new upward leg.
Market Analysis: Is This the Beginning of a Downtrend or a Temporary Shakeout?
In the recent developments within the E-mini S&P 500 (ES) on the daily timeframe, we’ve observed the formation of a distinct lower high following the recent all-time peak. This shift has seen prices breach the last identified higher-low area, establishing a new narrative. The sequence has transitioned from a higher high to a lower high, culminating in a movement into prior demand zones marked by increased volume, all while momentum appears to be rolling over.
On the four-hour chart, the prevailing trend reflects a series of lower highs and lower lows. The recent selloff has further entrenched this trajectory into the discount zone, now signaling proximity to the next Fibonacci retracement target below.
While momentum indicators have already dipped from overbought conditions, they have not yet reached deeply oversold thresholds, indicating potential for another leg downward following any short-term corrective bounce.
From a broader perspective, the long-term trend remains positive; however, a short- to medium-term corrective phase appears to be in play. Today’s market dynamics suggest we may be in the midst of this corrective leg rather than witnessing the final downturn.
As prices have recently entered a significant demand zone, a bounce lasting one to three sessions—or a period of sideways consolidation—seems likely before any potential further decline.
In summary, while current conditions favor a move towards lower prices in the days ahead, the market likely anticipates a "lower after a bounce" scenario rather than an immediate and steep decline.
Key resistance zones
Resistance is written as bands, not single ticks.
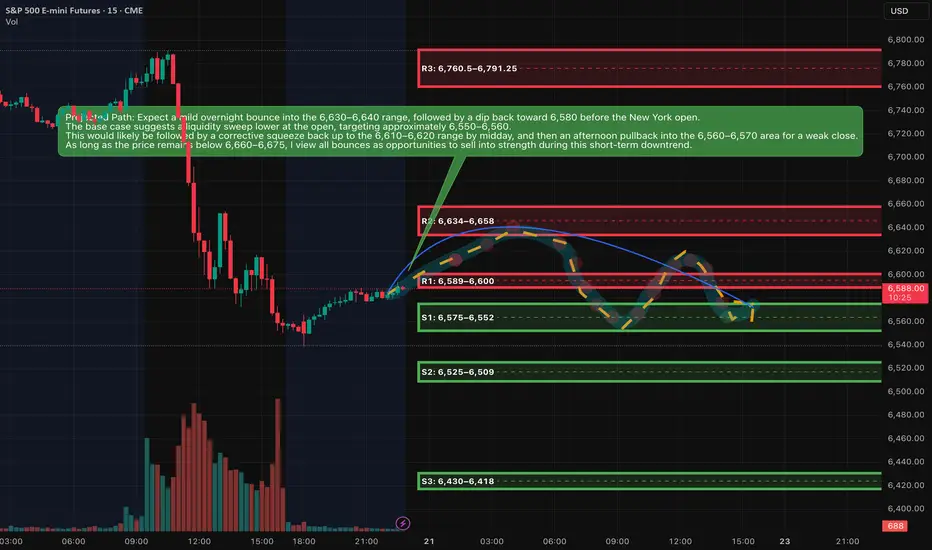
R1: 6,589–6,600
This band sits around the current Asia-session high and the underside of today’s New York low. It is the first lid above price. If rallies stall here, the tape stays heavy and favors another test of the lows.
R2: 6,634–6,658
This is the main breakdown zone from today, centered around the New York afternoon high and the upper edge of the late-session range. As long as ES trades below this shelf, the short-term downtrend remains intact and every bounce is suspect.
R3: 6,760.5–6,791.25
This band covers the New York morning low-to-high range and the origin of the big sell leg. If price ever retests this area and fails, it is a prime region for larger swing shorts. Only sustained trade and closes above this pocket would suggest the current corrective leg is ending.
---
Key support zones
S1: 6,575–6,552
This is the immediate floor combining the Asia-session low, New York afternoon low, and prior-day value low. It is where we are effectively trading now. Expect reactive bounces and stop-runs here, as both sides are active.
S2: 6,525–6,509
This is the next downside magnet if S1 breaks cleanly. It aligns with a fib extension and 4-hour demand. A decisive move into this region would represent the next step down in the correction.
S3: 6,430–6,418
Deeper extension and prior higher-timeframe demand. If the correction matures into a more serious pullback over several sessions, this pocket becomes a reasonable medium-term downside destination.
A++ Setup 1 – Short from R2 supply (continuation short)
Direction: Short
Entry zone: 6,638–6,648
SL (hard stop): 6,678
TP1: 6,588
TP2: 6,552
TP3: 6,515
Invalidation (structure):
If we get a 15m full-body close above 6,675, treat the short idea as invalid and stand aside; market is likely shifting into a squeeze toward 6,700+ instead of extending the down leg.
---
A++ Setup 2 – Quick-reclaim long from S1 demand (counter-trend bounce)
Direction: Long
Entry logic: need a flush then reclaim
Entry zone (after reclaim): 6,562–6,568
SL (hard stop): 6,538
TP1: 6,610
TP2: 6,638
TP3: 6,660
Invalidation (structure):
If price breaks below 6,552 and 15m closes stay below 6,545 without a fast reclaim, the bounce idea is invalid; then you wait for the deeper S2 zone instead of forcing longs here.
Good Luck !!!
The significant selloff observed today was not an arbitrary event. The day began with a robust rally following another impressive earnings report in the AI-chip sector, which propelled futures sharply upward and triggered a short squeeze in the Nasdaq. However, the release of a stronger-than-anticipated jobs report shifted the market's sentiment. While hiring showed signs of rebounding, the unemployment rate also ticked higher, undermining the prevailing narrative that the Federal Reserve would soon lower interest rates.
This development served as a stark reminder of the ongoing restrictive monetary policy, coupled with slowing economic growth and exorbitant valuations in the tech sector. Major investment funds capitalized on the morning’s strength in AI and large-cap stocks as an opportunity to reduce their risk exposure. Additionally, systematic trend-followers faced compulsion to sell once the S&P 500 fell below critical support levels.
The environment for high-beta assets, including cryptocurrencies, is already in a “reset” phase, which left little incentive for dip-buying at lower price points. As the E-mini S&P 500 futures broke through the previous day’s support levels, the situation escalated into a full liquidation. This perfect storm involved trapped long positions from the morning breakout, stop-loss orders falling into execution beneath yesterday’s lows, and mechanical selling, culminating in the largest intraday reversal since the spring.
Market Outlook
The current market sentiment is skewed bearish as the ES remains entrenched below the critical 6,660 to 6,700 range. The price is hovering near a significant demand zone established around the lows of the previous trading day and today’s New York session. While we can expect some upward bounces, these movements appear to be temporary rallies within an ongoing downtrend, rather than indicators of a potential new upward leg.
Market Analysis: Is This the Beginning of a Downtrend or a Temporary Shakeout?
In the recent developments within the E-mini S&P 500 (ES) on the daily timeframe, we’ve observed the formation of a distinct lower high following the recent all-time peak. This shift has seen prices breach the last identified higher-low area, establishing a new narrative. The sequence has transitioned from a higher high to a lower high, culminating in a movement into prior demand zones marked by increased volume, all while momentum appears to be rolling over.
On the four-hour chart, the prevailing trend reflects a series of lower highs and lower lows. The recent selloff has further entrenched this trajectory into the discount zone, now signaling proximity to the next Fibonacci retracement target below.
While momentum indicators have already dipped from overbought conditions, they have not yet reached deeply oversold thresholds, indicating potential for another leg downward following any short-term corrective bounce.
From a broader perspective, the long-term trend remains positive; however, a short- to medium-term corrective phase appears to be in play. Today’s market dynamics suggest we may be in the midst of this corrective leg rather than witnessing the final downturn.
As prices have recently entered a significant demand zone, a bounce lasting one to three sessions—or a period of sideways consolidation—seems likely before any potential further decline.
In summary, while current conditions favor a move towards lower prices in the days ahead, the market likely anticipates a "lower after a bounce" scenario rather than an immediate and steep decline.
Key resistance zones
Resistance is written as bands, not single ticks.
R1: 6,589–6,600
This band sits around the current Asia-session high and the underside of today’s New York low. It is the first lid above price. If rallies stall here, the tape stays heavy and favors another test of the lows.
R2: 6,634–6,658
This is the main breakdown zone from today, centered around the New York afternoon high and the upper edge of the late-session range. As long as ES trades below this shelf, the short-term downtrend remains intact and every bounce is suspect.
R3: 6,760.5–6,791.25
This band covers the New York morning low-to-high range and the origin of the big sell leg. If price ever retests this area and fails, it is a prime region for larger swing shorts. Only sustained trade and closes above this pocket would suggest the current corrective leg is ending.
---
Key support zones
S1: 6,575–6,552
This is the immediate floor combining the Asia-session low, New York afternoon low, and prior-day value low. It is where we are effectively trading now. Expect reactive bounces and stop-runs here, as both sides are active.
S2: 6,525–6,509
This is the next downside magnet if S1 breaks cleanly. It aligns with a fib extension and 4-hour demand. A decisive move into this region would represent the next step down in the correction.
S3: 6,430–6,418
Deeper extension and prior higher-timeframe demand. If the correction matures into a more serious pullback over several sessions, this pocket becomes a reasonable medium-term downside destination.
A++ Setup 1 – Short from R2 supply (continuation short)
Direction: Short
Entry zone: 6,638–6,648
SL (hard stop): 6,678
TP1: 6,588
TP2: 6,552
TP3: 6,515
Invalidation (structure):
If we get a 15m full-body close above 6,675, treat the short idea as invalid and stand aside; market is likely shifting into a squeeze toward 6,700+ instead of extending the down leg.
---
A++ Setup 2 – Quick-reclaim long from S1 demand (counter-trend bounce)
Direction: Long
Entry logic: need a flush then reclaim
Entry zone (after reclaim): 6,562–6,568
SL (hard stop): 6,538
TP1: 6,610
TP2: 6,638
TP3: 6,660
Invalidation (structure):
If price breaks below 6,552 and 15m closes stay below 6,545 without a fast reclaim, the bounce idea is invalid; then you wait for the deeper S2 zone instead of forcing longs here.
Good Luck !!!
If you want to contact me Email: info@algoindex.com or algoindex.com
相关出版物
免责声明
The information and publications are not meant to be, and do not constitute, financial, investment, trading, or other types of advice or recommendations supplied or endorsed by TradingView. Read more in the Terms of Use.