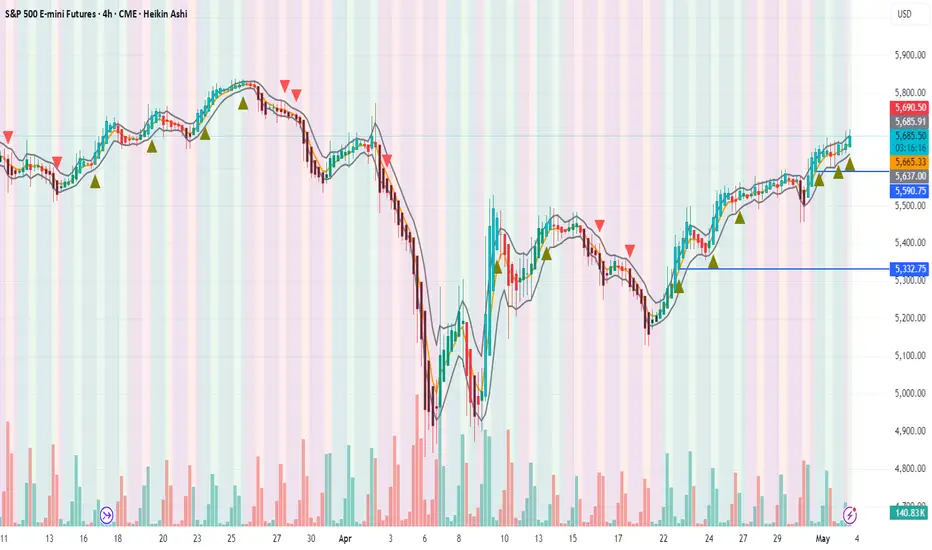
📢 The iSpark Indicator caught a strong breakout on the S&P 500 Index (4H chart) around the 5330 level, which was followed by a sequence of bullish moves — now reaching the 5700 mark.
🔍 Currently, price is testing the 10 EMA at 5710, which is acting as a short-term resistance. A clear break and sustained move above 5710 could trigger the next leg higher toward 5750–5775.
🎯 Holding positions? Stay in with a stop-loss at 5600 to manage risk.
📉 Fundamental caution: As always, keep an eye on macro headlines — unexpected global turmoil or sharp trade commentary (e.g., tariffs) may influence momentum
💡 This entire setup was captured early using the iSpark Indicator, designed to detect high-conviction breakouts across timeframes.
📬 Premium users interested in testing the iSpark Indicator can DM me for a hands-on walkthrough.
#SP500 #ES1! #Breakout #iSpark #TechnicalAnalysis #TradingStrategy #EMA #TrendFollowing #SPX #TradingView #SNP500
交易开始
All Targets' Achieved, Fresh Targets Open Now 5850++免责声明
这些信息和出版物并非旨在提供,也不构成TradingView提供或认可的任何形式的财务、投资、交易或其他类型的建议或推荐。请阅读使用条款了解更多信息。