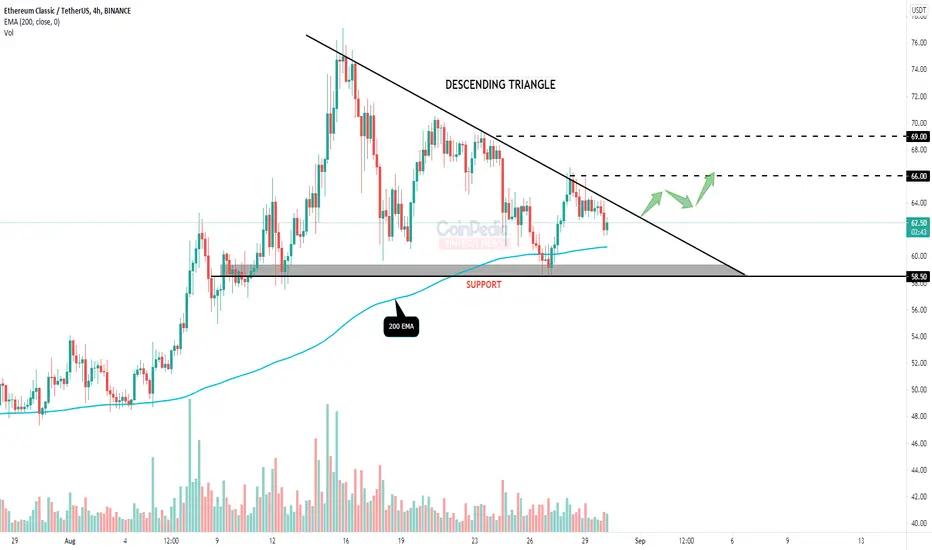
* Ethereum classic in 4H time frame forms a descending triangle with it's support near $58.5 and the above trend-line as it's resistance.
* The 200 EMA ( Exponential moving average ) is working as support for the price.
* If the price breaks the upper trend-line (resistance) we can expect a bullish move till $69.
* ETC is bearish below it's support zone.
* The 200 EMA ( Exponential moving average ) is working as support for the price.
* If the price breaks the upper trend-line (resistance) we can expect a bullish move till $69.
* ETC is bearish below it's support zone.
交易结束:到达目标
免责声明
这些信息和出版物并不意味着也不构成TradingView提供或认可的金融、投资、交易或其它类型的建议或背书。请在使用条款阅读更多信息。
免责声明
这些信息和出版物并不意味着也不构成TradingView提供或认可的金融、投资、交易或其它类型的建议或背书。请在使用条款阅读更多信息。