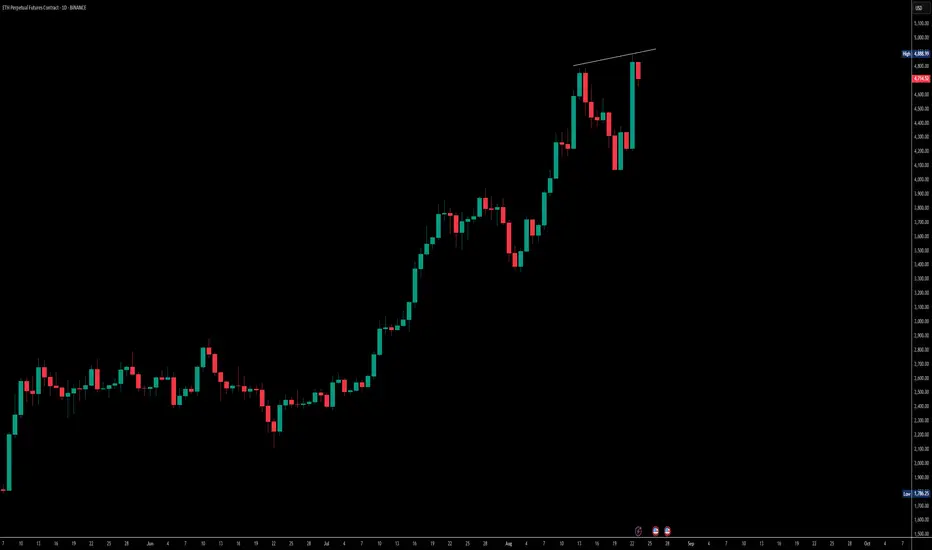
Looking at ETH on the daily timeframe, price action is pushing higher highs, but RSI isn’t fully aligned — it’s only forming a higher low. That usually tells us this move could just be a pullback rather than a strong bullish divergence.
ETH already retested the May 2021 levels, and from here a correction toward $4,450 seems likely. If it holds and rebounds there, momentum can continue, but if it fails, we should be ready for deeper downside. The key support to watch is $4,000 — losing that would open doors for another correction.
On the other side, the stochastic RSI is near the bottom, which suggests a possible bounce. But weekends often come with fake pumps and dumps, so patience is important. Monday evening or Tuesday morning looks like a better window to see whether ETH attempts a proper correction or not.
FOLLOW MY TELEGRAM CHANNEL FOR FREE : bit.ly/3JfrpgV
免责声明
这些信息和出版物并非旨在提供,也不构成TradingView提供或认可的任何形式的财务、投资、交易或其他类型的建议或推荐。请阅读使用条款了解更多信息。
FOLLOW MY TELEGRAM CHANNEL FOR FREE : bit.ly/3JfrpgV
免责声明
这些信息和出版物并非旨在提供,也不构成TradingView提供或认可的任何形式的财务、投资、交易或其他类型的建议或推荐。请阅读使用条款了解更多信息。