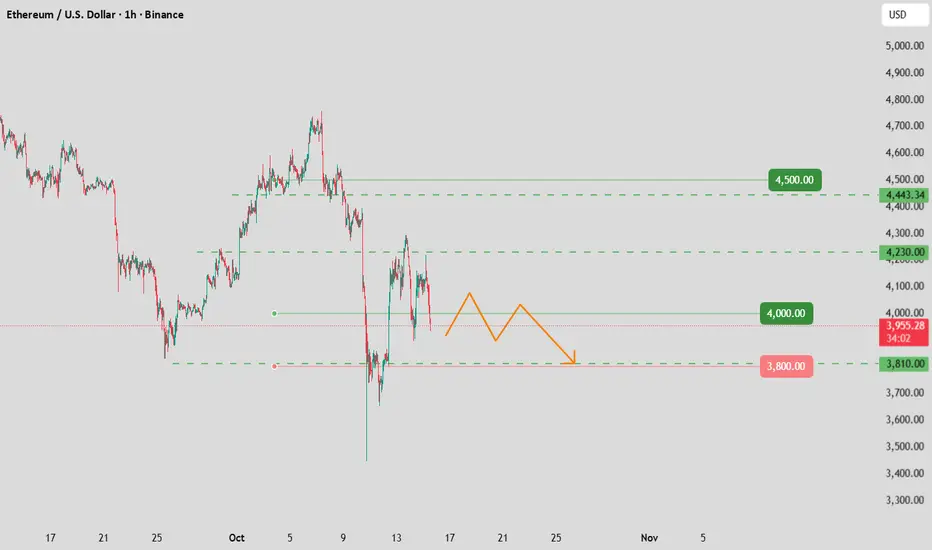
From a technical standpoint, Ethereum’s previous strong upward structure has been notably disrupted amid this pullback. The 1-hour K-line chart shows that after failing to break through the 4,788 high, ETH closed multiple consecutive long-bodied bearish candles. Its price has sequentially breached the MA5, MA20, and MA60 moving averages, marking a reversal in the short-term trend.
After the MACD indicator formed a "death cross" at a high level, the fast line has crossed below the zero line and entered the bearish zone. The green bearish momentum bars continue to expand, indicating that the short-term adjustment is not yet complete.
Today, Ethereum’s price is struggling to hold above the medium-term moving average. A break below this level could trigger a deeper decline.
Welcome to join my free channel for market updates: t.me/+EZspzjD8FT40YTY8
Daily update professional financial trading strategies: t.me/+6i-kmFunsMVkNzQ0
Let profitable trading become easier: t.me/+EZspzjD8FT40YTY8
Daily update professional financial trading strategies: t.me/+6i-kmFunsMVkNzQ0
Let profitable trading become easier: t.me/+EZspzjD8FT40YTY8
相关出版物
免责声明
这些信息和出版物并不意味着也不构成TradingView提供或认可的金融、投资、交易或其它类型的建议或背书。请在使用条款阅读更多信息。