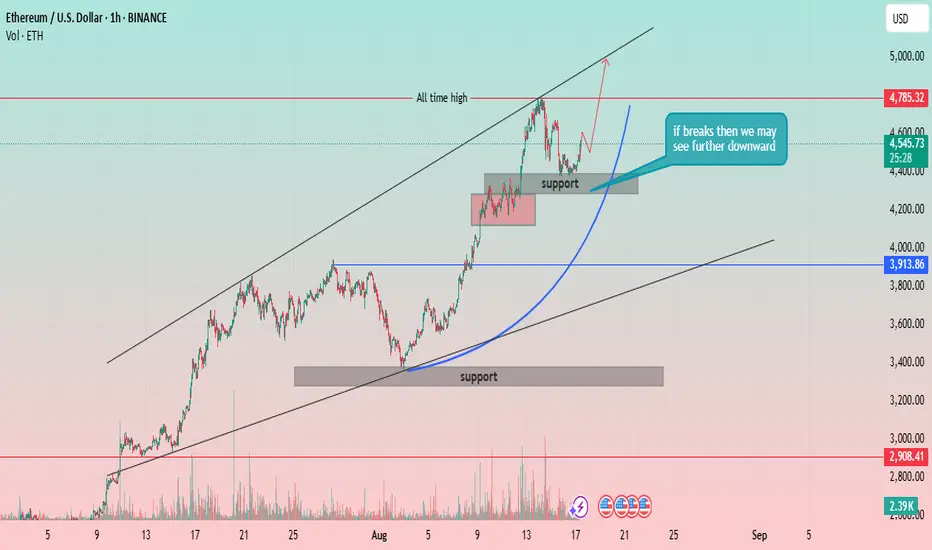
Strong Uptrend Channel: The price of Ethereum has been moving within a well-defined ascending channel, indicated by two parallel black trendlines. This strong channel suggests a sustained bullish momentum.
All-Time High: A significant resistance level is marked as the "all-time high" at approximately 4,785.32 USD. The price has recently tested this level.
Support Levels:
Major Support Zone: A broad support zone is identified between approximately 3,300 USD and 3,450 USD. This zone has previously acted as a strong base for a price rally.
Recent Support Zone: A smaller, more recent support zone is marked around 4,200 USD. The price has consolidated within this area after its recent push towards the all-time high.
Price Action and Projections:
The price recently reached a peak near the all-time high and has since pulled back, consolidating within the recent support zone.
A key annotation states, "if breaks then we may see further downward." This highlights the importance of the 4,200 USD support zone. A break below this level could indicate a potential deeper retracement, possibly towards the lower trendline of the channel or the major support zone.
A parabolic arc is drawn (blue line), suggesting a potential trajectory for the price to continue its move higher from the current level, with a goal of re-testing or breaking the all-time high.
Volume: The chart includes a volume indicator, showing significant volume spikes during the major rallies and drops, confirming strong market interest and participation.
交易结束:到达目标
join my telegram channel free
t.me/Pips_and_profits1
t.me/Pips_and_profits1
Daily 300+pips profits
weekly 2000+pips profit
High accuracy signals with double conformation
t.me/Pips_and_profits1
t.me/Pips_and_profits1
Daily 300+pips profits
weekly 2000+pips profit
High accuracy signals with double conformation
相关出版物
免责声明
这些信息和出版物并非旨在提供,也不构成TradingView提供或认可的任何形式的财务、投资、交易或其他类型的建议或推荐。请阅读使用条款了解更多信息。