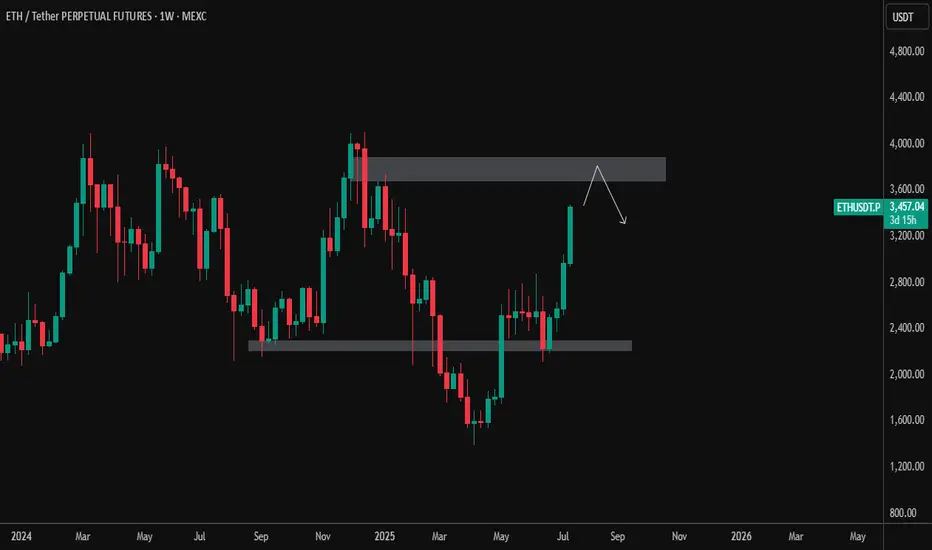
Ethereum has shown a strong bullish push, breaking above the prior consolidation zone between $2,400–$2,600. Price is now approaching a significant weekly supply zone between $3,800–$4,100 — a region that previously acted as a major reversal point.
🔹 Current Price: ~$3,460
🔹 Resistance Zone: $3,800–$4,100
🔹 Support Zone: $2,400–$2,600
📌 Possible Scenarios:
Rejection from resistance: ETH may test the upper supply zone and face selling pressure, triggering a pullback toward the mid-range or support.
Breakout & Close Above $4,100: Would signal strong bullish continuation with potential targets toward new highs.
📉 Watch for: Bearish price action near resistance or a potential lower high forming.
📈 Bullish Bias Confirmed if: Weekly close above $4,100 with volume support.
🧠 Patience is key at major levels. Let price action guide the next move.
免责声明
这些信息和出版物并不意味着也不构成TradingView提供或认可的金融、投资、交易或其它类型的建议或背书。请在使用条款阅读更多信息。