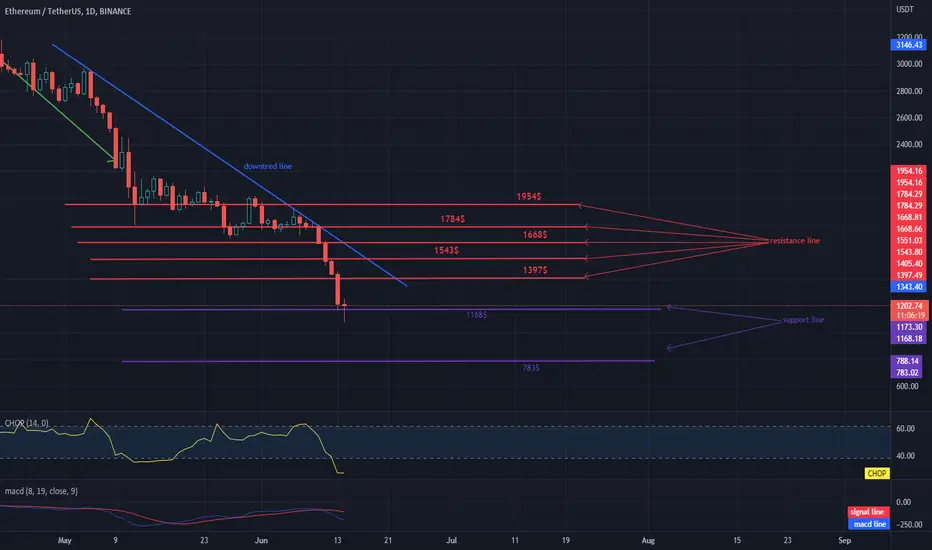
Hello everyone, let's take a look at the ETH to USDT chart on the 1 day time frame as you can see the price is moving below the downtrend line.
Let's start with the designation of the support line and as you can see the first support from which the price has already rebounded $ 1168, if the support is broken, the next one is $ 783
Now let's move from the resistance line as you can see the first resistance is $ 1,397, if you can break it the next resistance will be $ 1,543, $ 1,668, $ 1,784 and $ 1,954.
Looking at the CHOP indicator , we can see that the energy has been used for the current decline in the 1-day interval, while the MACD indicator shows that we are in a downward trend.
免责声明
这些信息和出版物并不意味着也不构成TradingView提供或认可的金融、投资、交易或其它类型的建议或背书。请在使用条款阅读更多信息。
免责声明
这些信息和出版物并不意味着也不构成TradingView提供或认可的金融、投资、交易或其它类型的建议或背书。请在使用条款阅读更多信息。