Here is an update to our post over 45 days ago:

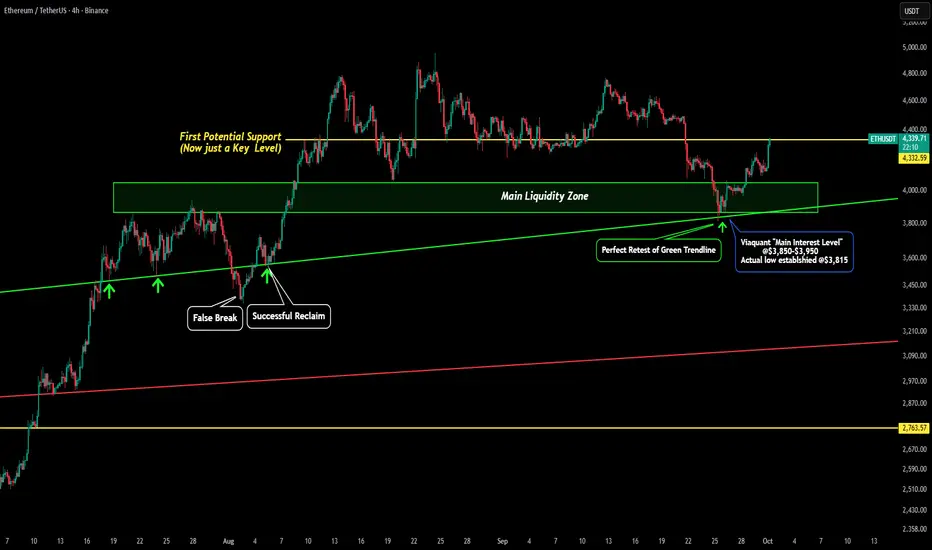
From the time we hit the top @$4,950 we laid out all the levels to watch for ETH. We were watching some short term levels but the MAIN level we were watching for was the green box titled "MAIN LIQUIDITY ZONE". This zone ranged from $3,800-$4,100.
Since this was a multi-year resistance level we were watching it to act as a new macro support level. We pointed out how "buyers should find this level very appealing if we get a dip to there. The main interest level would lie between $3,850-$3,950."
Current day we can see how perfectly this prediction played out.
First main thing to not is the accuracy of our targets: the main level of interest ($3,850-3,950) was just $35 higher than where the actual bottom was established!
Also the "MAIN LIQUDITY ZONE" was even better with it only be $15 lower than the actual bottom being established at $3,815!!
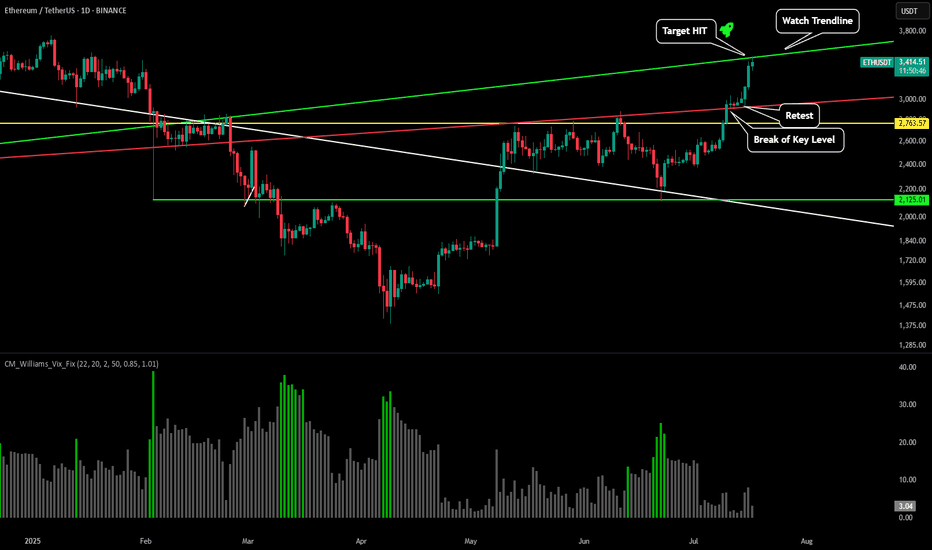
The next key thing to note is how accurately price retested our green trendline. I have been posting about this green trendline for the past 3 months! Here are some other charts where I had this trendline that called the bottom drawn.


From the time we hit the top @$4,950 we laid out all the levels to watch for ETH. We were watching some short term levels but the MAIN level we were watching for was the green box titled "MAIN LIQUIDITY ZONE". This zone ranged from $3,800-$4,100.
Since this was a multi-year resistance level we were watching it to act as a new macro support level. We pointed out how "buyers should find this level very appealing if we get a dip to there. The main interest level would lie between $3,850-$3,950."
Current day we can see how perfectly this prediction played out.
First main thing to not is the accuracy of our targets: the main level of interest ($3,850-3,950) was just $35 higher than where the actual bottom was established!
Also the "MAIN LIQUDITY ZONE" was even better with it only be $15 lower than the actual bottom being established at $3,815!!
The next key thing to note is how accurately price retested our green trendline. I have been posting about this green trendline for the past 3 months! Here are some other charts where I had this trendline that called the bottom drawn.
免责声明
The information and publications are not meant to be, and do not constitute, financial, investment, trading, or other types of advice or recommendations supplied or endorsed by TradingView. Read more in the Terms of Use.
免责声明
The information and publications are not meant to be, and do not constitute, financial, investment, trading, or other types of advice or recommendations supplied or endorsed by TradingView. Read more in the Terms of Use.