A “long-legged” doji is a far more dramatic candle. It says that prices moved far higher on the day, but then profit taking kicked in.
Typically, a very large upper shadow is left. A close below the midpoint of the candle shows a lot of weakness.
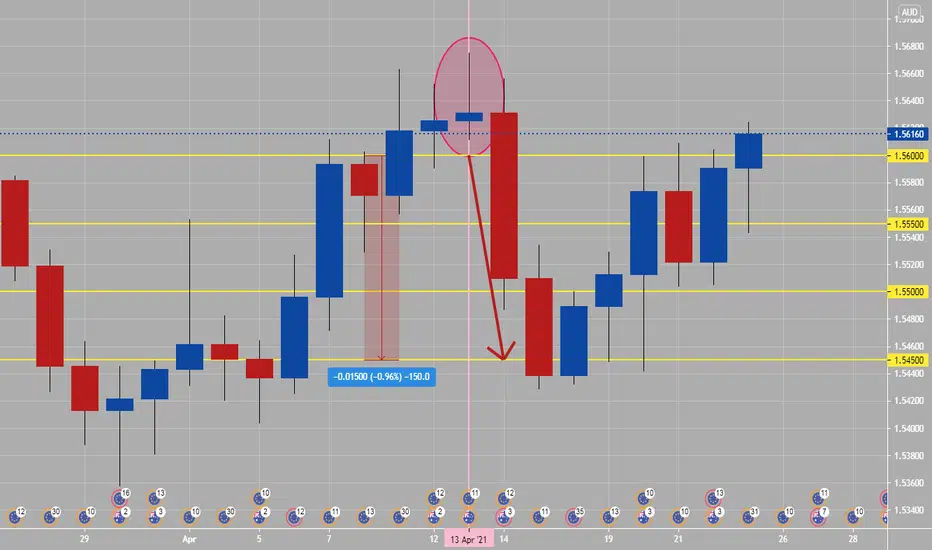
Here’s an example of a long-legged doji on attached chart (inside of oval circle). Daily candlesticks and patterns are more important then lower time frame ones, related to having one whole days of price action inside of them.
Monday and Tuesday daily candlesticks mostly will set high or low of the week, which rest of week trend will break out or come out of. The noted long legged doji occurred on a Tuesday, then rest of week was sell or bearish.
Typically, a very large upper shadow is left. A close below the midpoint of the candle shows a lot of weakness.
Here’s an example of a long-legged doji on attached chart (inside of oval circle). Daily candlesticks and patterns are more important then lower time frame ones, related to having one whole days of price action inside of them.
Monday and Tuesday daily candlesticks mostly will set high or low of the week, which rest of week trend will break out or come out of. The noted long legged doji occurred on a Tuesday, then rest of week was sell or bearish.
免责声明
这些信息和出版物并非旨在提供,也不构成TradingView提供或认可的任何形式的财务、投资、交易或其他类型的建议或推荐。请阅读使用条款了解更多信息。