🔹Technical Analysis Of EURGBP
▪ Chart Pattern: Symmetrical Triangle Formation
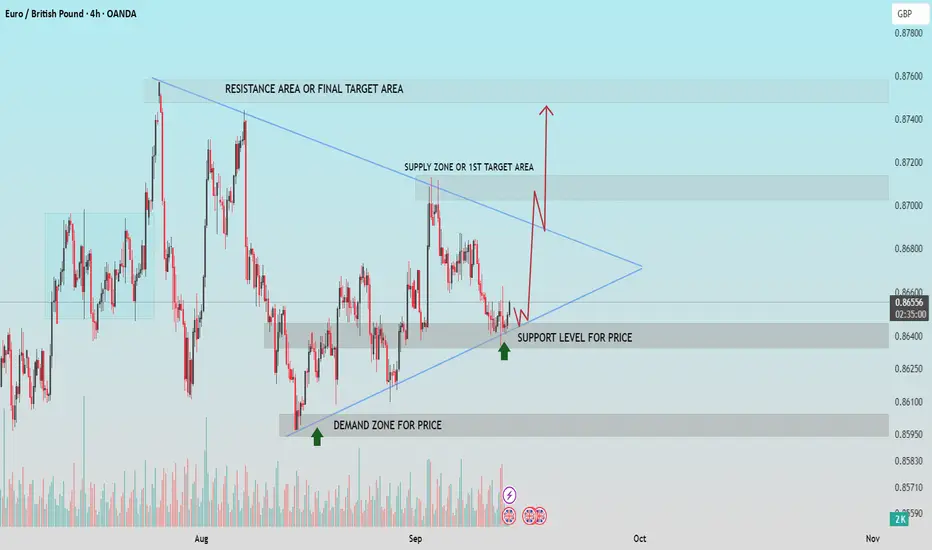
The price action is currently trading within a symmetrical triangle pattern, indicating consolidation and a potential breakout setup. The pattern shows higher lows and lower highs, suggesting a squeeze in volatility.
▪ Key Support and Demand Zone
Support Level: Around 0.86400
Demand Zone: 0.85950 – 0.86100
These levels have held well in recent price action, evidenced by multiple rejections marked by green arrows. Bulls are defending this area, making it a critical zone for potential upward momentum.
▪Bullish Breakout Expectation
If the price holds the support level and breaks out of the triangle to the upside:
First Target (Supply Zone): 0.87000 – 0.87200
Final Target (Resistance Zone): 0.87550 – 0.87750
The chart suggests a possible breakout from the triangle with a retest, followed by a rally toward the supply and resistance zones.
▪Volume Observation
Volume shows a slight increase on bullish pushes, hinting at accumulation and potential breakout interest. A spike in volume would confirm the breakout validity.
▪Conclusion
The EUR/GBP pair is coiling for a breakout. A strong bullish move above the triangle could target the 0.87000 and eventually 0.87700 levels. Traders should watch for confirmation with volume and retest behavior around the breakout point.
Support Me For More Insightful Analysis.
▪ Chart Pattern: Symmetrical Triangle Formation
The price action is currently trading within a symmetrical triangle pattern, indicating consolidation and a potential breakout setup. The pattern shows higher lows and lower highs, suggesting a squeeze in volatility.
▪ Key Support and Demand Zone
Support Level: Around 0.86400
Demand Zone: 0.85950 – 0.86100
These levels have held well in recent price action, evidenced by multiple rejections marked by green arrows. Bulls are defending this area, making it a critical zone for potential upward momentum.
▪Bullish Breakout Expectation
If the price holds the support level and breaks out of the triangle to the upside:
First Target (Supply Zone): 0.87000 – 0.87200
Final Target (Resistance Zone): 0.87550 – 0.87750
The chart suggests a possible breakout from the triangle with a retest, followed by a rally toward the supply and resistance zones.
▪Volume Observation
Volume shows a slight increase on bullish pushes, hinting at accumulation and potential breakout interest. A spike in volume would confirm the breakout validity.
▪Conclusion
The EUR/GBP pair is coiling for a breakout. A strong bullish move above the triangle could target the 0.87000 and eventually 0.87700 levels. Traders should watch for confirmation with volume and retest behavior around the breakout point.
Support Me For More Insightful Analysis.
交易开始
from support level 注释
注释
1st target achieved,交易结束:到达目标
注释
💸FREE FOREX Signals in Telegram : t.me/FxInsightsHub0
🔹Join Our Telegram Channel, Pure Price Action Based Signals With Chart Analysis.
t.me/FxInsightsHub0
🚀FREE CRYPTO Signals In Telegram: t.me/FxInsightsHub0
🔹Join Our Telegram Channel, Pure Price Action Based Signals With Chart Analysis.
t.me/FxInsightsHub0
🚀FREE CRYPTO Signals In Telegram: t.me/FxInsightsHub0
相关出版物
免责声明
这些信息和出版物并不意味着也不构成TradingView提供或认可的金融、投资、交易或其它类型的建议或背书。请在使用条款阅读更多信息。