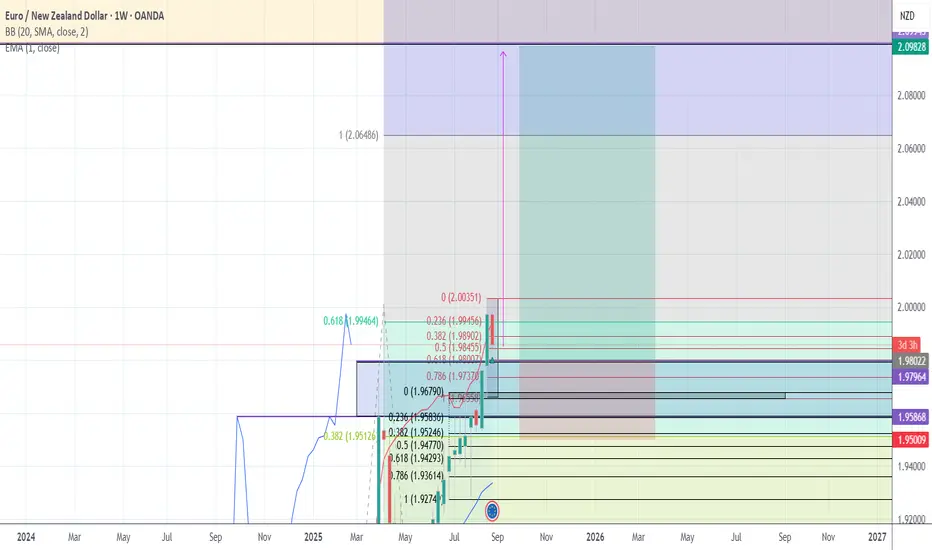
Multi-timeframe analysis using Fibonacci retracement.
The black Fibonacci is drawn from the monthly closed candle (higher timeframe trend).
The red Fibonacci is drawn from the weekly closed candle (shorter-term retracement).
Key Levels:
0.236 (1.9945) → first resistance
0.382 (1.9890) & 0.5 (1.9850) → intermediate support zones
0.618 (1.9804) → main support level
0.786 (1.9737) → critical support; a break below may extend towards 1.9670 – 1.9520
If support holds, the next bullish target is around 2.00 – 2.0648 (Fibo extension)
Position Management:
Stop Loss is placed just below the previous closed weekly candle (weekly spike).
A trailing stop of 1–1.5 ATR is used, always adjusted below the latest weekly spike.
This provides protection while letting the trend run.
Partial profits can be taken near 2.00, while the main bullish target remains 2.06 (Fibo extension).
免责声明
这些信息和出版物并不意味着也不构成TradingView提供或认可的金融、投资、交易或其它类型的建议或背书。请在使用条款阅读更多信息。
免责声明
这些信息和出版物并不意味着也不构成TradingView提供或认可的金融、投资、交易或其它类型的建议或背书。请在使用条款阅读更多信息。