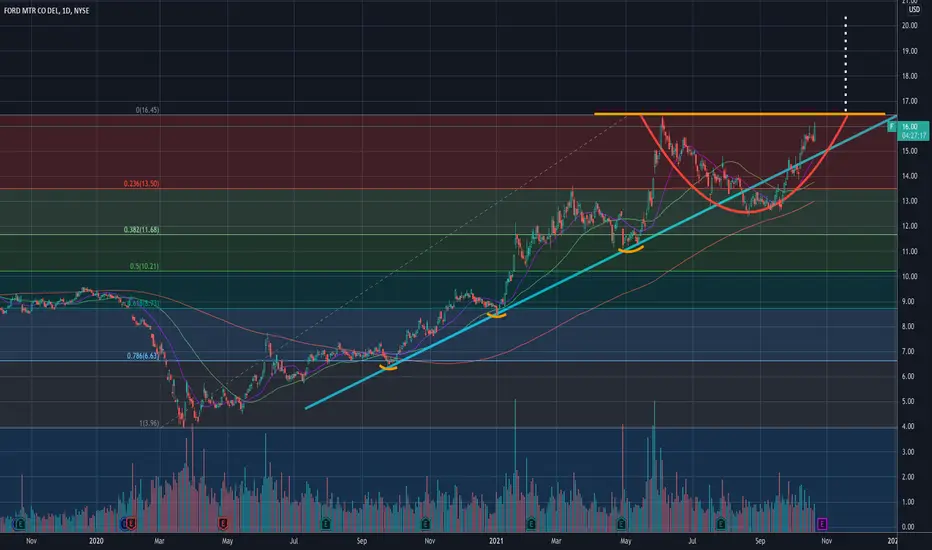
Ford is right now forming a cup. Breaking above the prior high of 16.43 could send the stock to $20!
Which co-insides with the credit susie's analyst's new target price. Perhaps he did it based on technicals as well? :)
Target - $20
———————————————————
How to read my charts?
- Matching color trend lines shows the pattern. Sometimes a chart can have multiple patterns. Each pattern will have matching color trend lines.
- The yellow horizontal lines shows support and resistance areas.
- Fib lines also shows support and resistance areas.
- The dotted white lines shows price projection for breakout or breakdown target.
Disclaimer: Do your own DD. Not an investment advice.
注释
Target reached. It could still continue upward. New chart will come in the future with new targets.I am not a licensed professional. None of the posts that I published are investment advice. Do your own research.
免责声明
这些信息和出版物并不意味着也不构成TradingView提供或认可的金融、投资、交易或其它类型的建议或背书。请在使用条款阅读更多信息。
I am not a licensed professional. None of the posts that I published are investment advice. Do your own research.
免责声明
这些信息和出版物并不意味着也不构成TradingView提供或认可的金融、投资、交易或其它类型的建议或背书。请在使用条款阅读更多信息。