Recently, the structure of FCPO shifted into a Higher High, which indicates a Bullish Trend.
After breaking the resistance, we can see a base formation, suggesting a lower-risk area to participate on the Buy side.
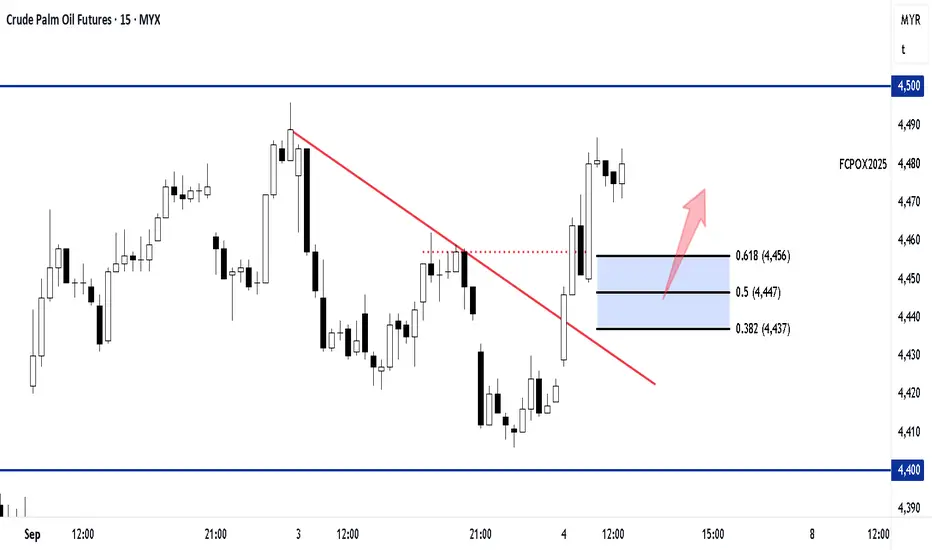
The blue zone represents the Fibonacci retracement area (0.618 – 0.382).
If price retests this zone and forms a reversal confirmation pattern (such as rejection, engulfing, or pinbar), the probability of a continuation to the upside is stronger.
However, if price breaks below the 0.382 (around 4,437) level, this outlook can be considered invalid.
Strategy outline:
Entry: Wait for a retest of the Fibonacci zone and confirmation of reversal pattern.
Exit: Cut loss if price closes below 0.382.
Potential target: Nearest resistance around 4,500, with possible extension if momentum remains strong.
📌 This analysis is prepared for educational purposes only. It is not a buy or sell recommendation. Please manage your own risk accordingly.
Not a Buy Call, only for you to know how regarding Money Management, and how Setup is Work. Risk of Loss is there, Potential for Profit also there.
After breaking the resistance, we can see a base formation, suggesting a lower-risk area to participate on the Buy side.
The blue zone represents the Fibonacci retracement area (0.618 – 0.382).
If price retests this zone and forms a reversal confirmation pattern (such as rejection, engulfing, or pinbar), the probability of a continuation to the upside is stronger.
However, if price breaks below the 0.382 (around 4,437) level, this outlook can be considered invalid.
Strategy outline:
Entry: Wait for a retest of the Fibonacci zone and confirmation of reversal pattern.
Exit: Cut loss if price closes below 0.382.
Potential target: Nearest resistance around 4,500, with possible extension if momentum remains strong.
📌 This analysis is prepared for educational purposes only. It is not a buy or sell recommendation. Please manage your own risk accordingly.
Not a Buy Call, only for you to know how regarding Money Management, and how Setup is Work. Risk of Loss is there, Potential for Profit also there.
注释
Price reaching the zone..交易开始
注释
M15 have bullish candle. That is one signal.注释
For risk management,Stop Loss has been placed at current low - 1 tick @ 4431
交易结束:到达止损
Stop Loss triggered免责声明
这些信息和出版物并不意味着也不构成TradingView提供或认可的金融、投资、交易或其它类型的建议或背书。请在使用条款阅读更多信息。