🔍 Technical Analysis Summary
📈 Trend and Price Action
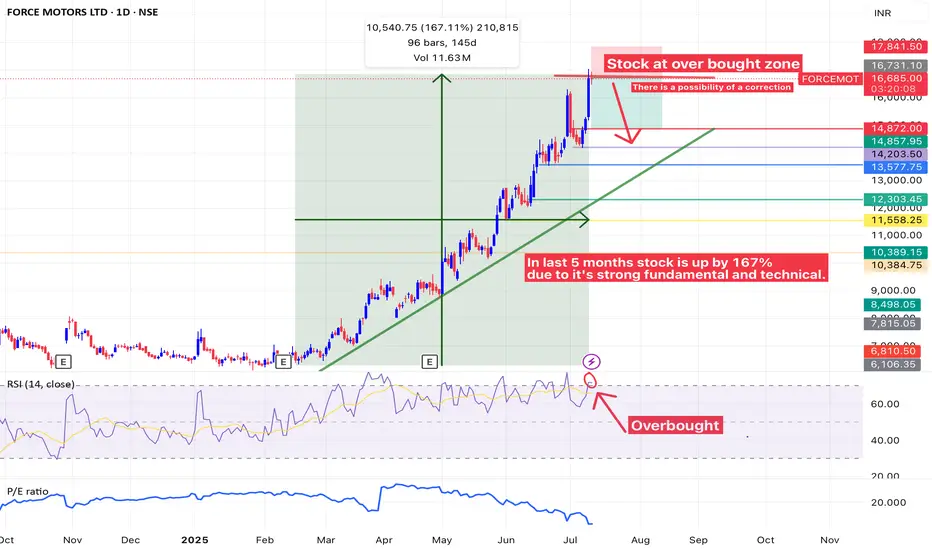
• The stock has shown strong bullish momentum, gaining 167.11% in the last 145 days (about 5 months).
• Price action is respecting a steep upward trendline, indicating persistent buying interest and a strong uptrend.
• Current Price: ₹16,731 (as shown)
• Significant resistance zone: Around ₹16,700–₹17,000 (price appears to be stalling here).
⸻
⚠️ Overbought Signal
• The RSI (Relative Strength Index, 14-period) is in the overbought zone (>70), currently indicating:
• Overextension of the rally.
• Possible short-term correction or consolidation phase ahead.
• The RSI also shows a bearish crossover, where the RSI line crosses below the signal line, which can signal weakening momentum.
⸻
🔻 Correction Possibility
• As noted on the chart: “There is a possibility of a correction.”
• The first potential support levels in case of a pullback:
• ₹14,872
• ₹14,857.95
• ₹14,203.50
• ₹13,577.75 (near the trendline support)
• Strong base zone: ₹12,303.45 – ₹12,000
These levels could serve as buy-on-dip zones for long-term investors if fundamentals remain intact.
⸻
📊 Volume and PE Ratio
• Volume seems steady but not spiking dramatically—indicating healthy participation, not euphoria.
• P/E Ratio line at the bottom appears to be falling slightly, which could mean:
• Earnings have improved or stock price growth is now slightly outpacing earnings.
⸻
📌 Key Observations
• ✅ Uptrend remains intact: No major breakdown of structure yet.
• ⚠️ Overbought condition: RSI and steep price rise warn of potential short-term correction.
• 🔄 Healthy retracement expected: As part of a bullish continuation pattern or to retest support zones.
• 📉 Bearish divergence potential: If RSI forms a lower high while price makes a higher high (not clearly visible yet).
⸻
📈 Final Verdict:
Short-term: Caution is advised. Wait for confirmation of a pullback or consolidation before entering new positions.
Medium to Long-term: Still bullish due to strong price action and fundamentals, but consider partial profit-booking or trailing stop losses.
⸻
Would you like a deeper analysis using Fibonacci retracement or want a target estimation after correction?
📈 Trend and Price Action
• The stock has shown strong bullish momentum, gaining 167.11% in the last 145 days (about 5 months).
• Price action is respecting a steep upward trendline, indicating persistent buying interest and a strong uptrend.
• Current Price: ₹16,731 (as shown)
• Significant resistance zone: Around ₹16,700–₹17,000 (price appears to be stalling here).
⸻
⚠️ Overbought Signal
• The RSI (Relative Strength Index, 14-period) is in the overbought zone (>70), currently indicating:
• Overextension of the rally.
• Possible short-term correction or consolidation phase ahead.
• The RSI also shows a bearish crossover, where the RSI line crosses below the signal line, which can signal weakening momentum.
⸻
🔻 Correction Possibility
• As noted on the chart: “There is a possibility of a correction.”
• The first potential support levels in case of a pullback:
• ₹14,872
• ₹14,857.95
• ₹14,203.50
• ₹13,577.75 (near the trendline support)
• Strong base zone: ₹12,303.45 – ₹12,000
These levels could serve as buy-on-dip zones for long-term investors if fundamentals remain intact.
⸻
📊 Volume and PE Ratio
• Volume seems steady but not spiking dramatically—indicating healthy participation, not euphoria.
• P/E Ratio line at the bottom appears to be falling slightly, which could mean:
• Earnings have improved or stock price growth is now slightly outpacing earnings.
⸻
📌 Key Observations
• ✅ Uptrend remains intact: No major breakdown of structure yet.
• ⚠️ Overbought condition: RSI and steep price rise warn of potential short-term correction.
• 🔄 Healthy retracement expected: As part of a bullish continuation pattern or to retest support zones.
• 📉 Bearish divergence potential: If RSI forms a lower high while price makes a higher high (not clearly visible yet).
⸻
📈 Final Verdict:
Short-term: Caution is advised. Wait for confirmation of a pullback or consolidation before entering new positions.
Medium to Long-term: Still bullish due to strong price action and fundamentals, but consider partial profit-booking or trailing stop losses.
⸻
Would you like a deeper analysis using Fibonacci retracement or want a target estimation after correction?
免责声明
这些信息和出版物并非旨在提供,也不构成TradingView提供或认可的任何形式的财务、投资、交易或其他类型的建议或推荐。请阅读使用条款了解更多信息。
免责声明
这些信息和出版物并非旨在提供,也不构成TradingView提供或认可的任何形式的财务、投资、交易或其他类型的建议或推荐。请阅读使用条款了解更多信息。