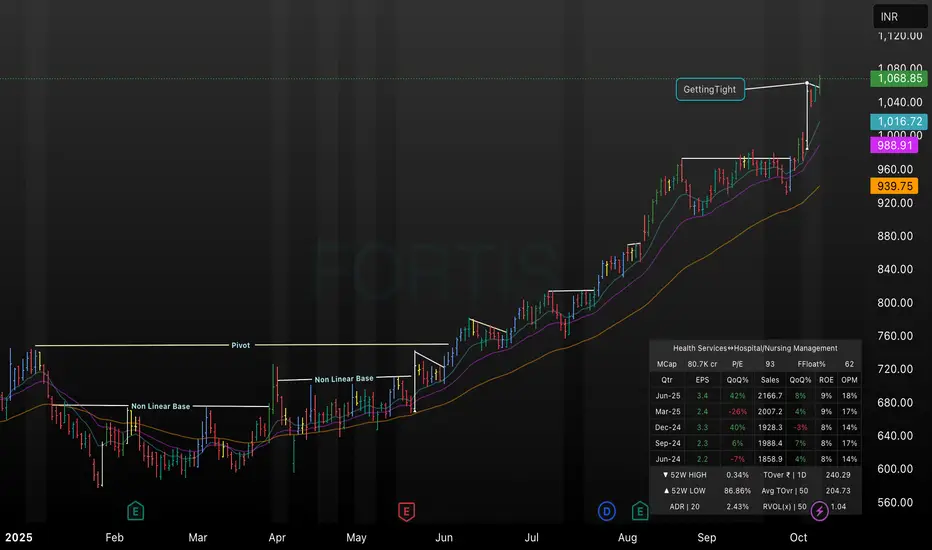
This TradingView daily chart for Fortis (2025) illustrates key technical setups including two clearly labeled non-linear base formations, a major pivot breakout, and subsequent price consolidation zones. The chart captures the transition from range-bound action to a strong bullish move, highlighting the “Getting Tight” pattern before this recent surge. Additional metrics such as moving averages, volume overlays, and stock fundamentals are visible, providing a comprehensive overview for swing or positional traders seeking technical clarity.
免责声明
这些信息和出版物并不意味着也不构成TradingView提供或认可的金融、投资、交易或其它类型的建议或背书。请在使用条款阅读更多信息。
免责声明
这些信息和出版物并不意味着也不构成TradingView提供或认可的金融、投资、交易或其它类型的建议或背书。请在使用条款阅读更多信息。