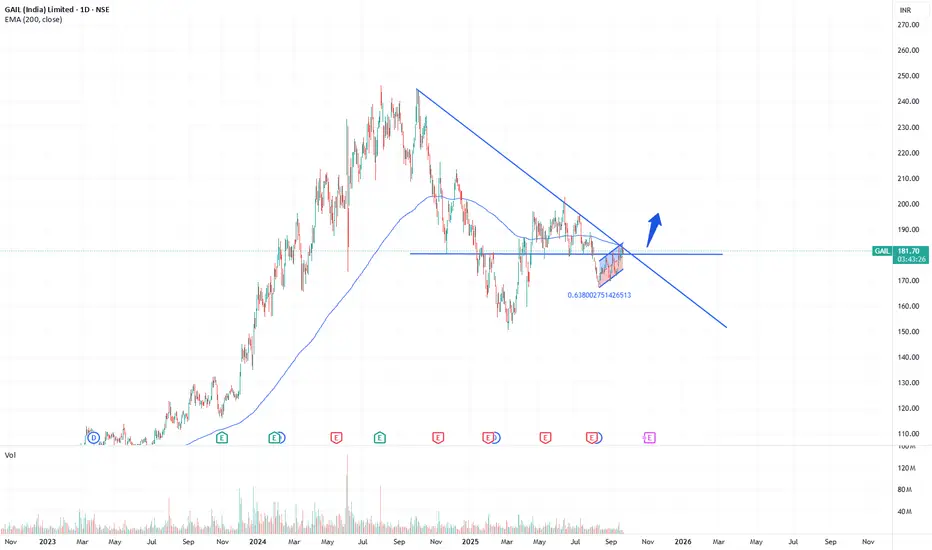
Trendline Break: Price is currently testing the long-term descending trendline near 182–185. Watching whether it sustains above this zone or reacts lower. This will be the first sign of buyers regaining control.
Channel Formation: Price is moving inside a rising channel. A move outside this channel will indicate the next direction — either strength if it breaks higher, or weakness if it breaks lower.
Horizontal Level: The 180 neckline has been tested multiple times and is acting as a strong support. Price is currently trading just above this level.
Indicators:
Disclaimer: This is for educational purposes only and not investment advice. I am not a SEBI registered advisor.
Channel Formation: Price is moving inside a rising channel. A move outside this channel will indicate the next direction — either strength if it breaks higher, or weakness if it breaks lower.
Horizontal Level: The 180 neckline has been tested multiple times and is acting as a strong support. Price is currently trading just above this level.
Indicators:
- RSI (60.7): Momentum is in the bullish zone but not overbought.
- MACD: Just crossed into positive territory, showing early signs of strength.
- EMA 200 (181.9): Price is right at the 200 EMA. Sustaining above it would be a positive sign.
Disclaimer: This is for educational purposes only and not investment advice. I am not a SEBI registered advisor.
免责声明
The information and publications are not meant to be, and do not constitute, financial, investment, trading, or other types of advice or recommendations supplied or endorsed by TradingView. Read more in the Terms of Use.
免责声明
The information and publications are not meant to be, and do not constitute, financial, investment, trading, or other types of advice or recommendations supplied or endorsed by TradingView. Read more in the Terms of Use.